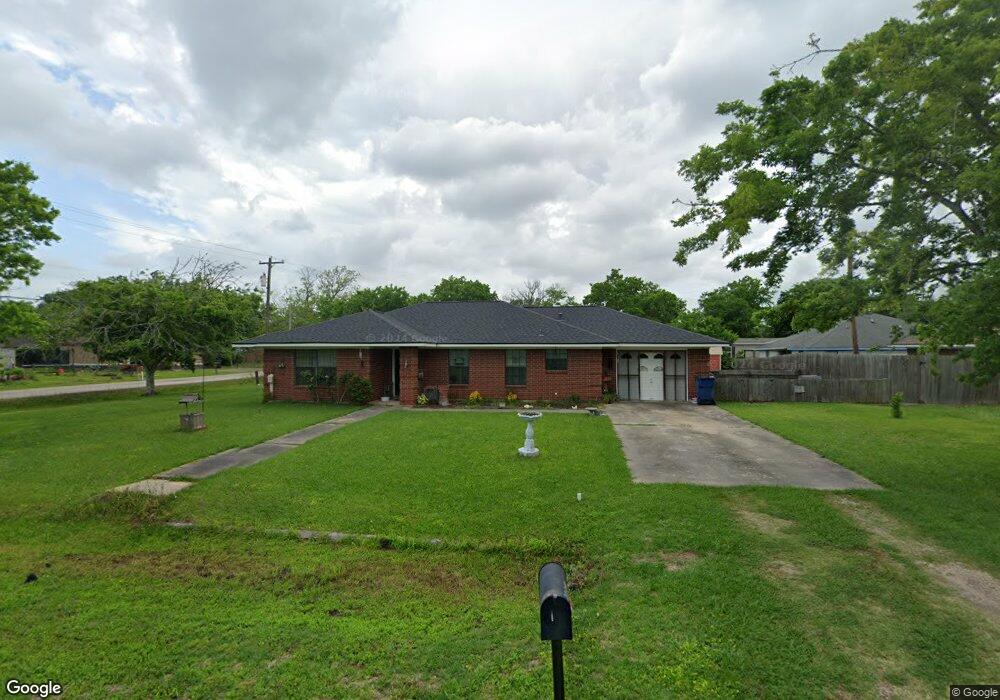
205 Cherry St Brazoria, TX 77422
Estimated Value: $211,000 - $228,370
2
Beds
2
Baths
1,485
Sq Ft
$150/Sq Ft
Est. Value
About This Home
This home is located at 205 Cherry St, Brazoria, TX 77422 and is currently estimated at $222,593, approximately $149 per square foot. 205 Cherry St is a home located in Brazoria County.
Ownership History
Date
Name
Owned For
Owner Type
Purchase Details
Closed on
Feb 22, 2019
Sold by
Hildebrandt Cody W and Hildebrandt Allyssa
Bought by
Edwards Caleb James
Current Estimated Value
Home Financials for this Owner
Home Financials are based on the most recent Mortgage that was taken out on this home.
Original Mortgage
$150,380
Outstanding Balance
$135,040
Interest Rate
5.62%
Mortgage Type
Purchase Money Mortgage
Estimated Equity
$87,553
Purchase Details
Closed on
Sep 26, 2013
Sold by
Robinson Ruby
Bought by
Hildebrandt Cody W
Home Financials for this Owner
Home Financials are based on the most recent Mortgage that was taken out on this home.
Original Mortgage
$94,261
Interest Rate
4.87%
Mortgage Type
FHA
Purchase Details
Closed on
Mar 1, 2011
Sold by
Williams Veron
Bought by
Robinson Ruby and Williams Veron
Create a Home Valuation Report for This Property
The Home Valuation Report is an in-depth analysis detailing your home's value as well as a comparison with similar homes in the area
Home Values in the Area
Average Home Value in this Area
Purchase History
| Date | Buyer | Sale Price | Title Company |
|---|---|---|---|
| Edwards Caleb James | -- | None Available | |
| Hildebrandt Cody W | -- | None Available | |
| Robinson Ruby | -- | None Available |
Source: Public Records
Mortgage History
| Date | Status | Borrower | Loan Amount |
|---|---|---|---|
| Open | Edwards Caleb James | $150,380 | |
| Previous Owner | Hildebrandt Cody W | $94,261 |
Source: Public Records
Tax History Compared to Growth
Tax History
| Year | Tax Paid | Tax Assessment Tax Assessment Total Assessment is a certain percentage of the fair market value that is determined by local assessors to be the total taxable value of land and additions on the property. | Land | Improvement |
|---|---|---|---|---|
| 2025 | $3,368 | $225,720 | $23,330 | $202,390 |
| 2023 | $3,368 | $219,167 | $24,970 | $209,510 |
| 2022 | $4,721 | $209,000 | $22,040 | $186,960 |
| 2021 | $4,269 | $181,130 | $19,100 | $162,030 |
| 2020 | $4,333 | $175,180 | $17,630 | $157,550 |
| 2019 | $4,145 | $162,370 | $9,440 | $152,930 |
| 2018 | $3,811 | $148,470 | $9,330 | $139,140 |
| 2017 | $3,675 | $148,470 | $9,330 | $139,140 |
| 2016 | $3,341 | $136,720 | $7,780 | $128,940 |
| 2014 | $2,347 | $104,030 | $7,780 | $96,250 |
Source: Public Records
Map
Nearby Homes