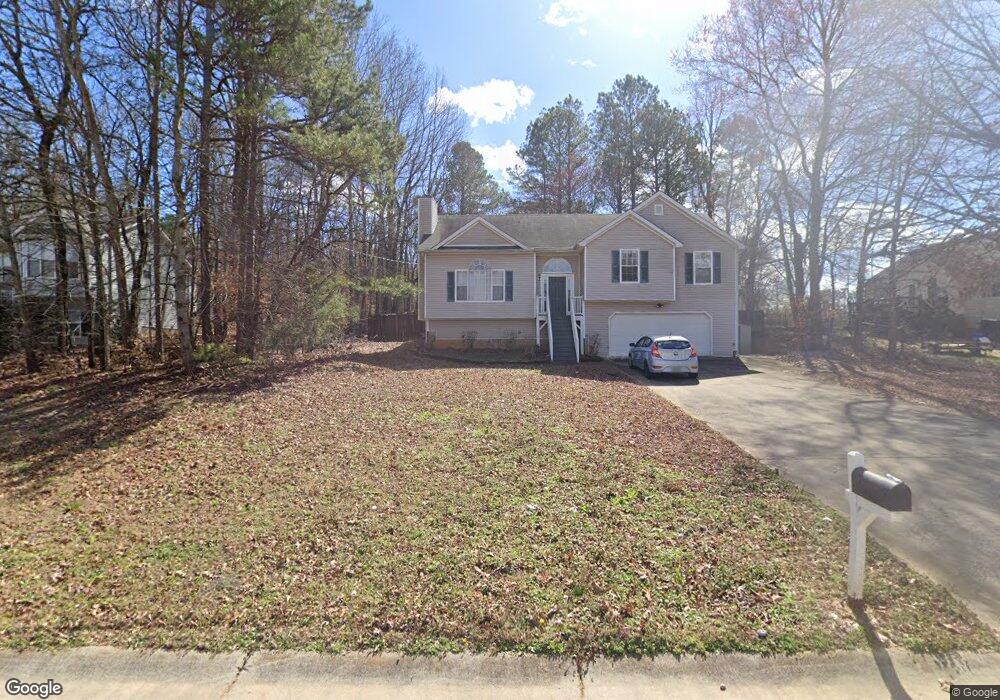
205 Cornell Ct Villa Rica, GA 30180
Estimated Value: $260,579 - $282,000
3
Beds
2
Baths
1,444
Sq Ft
$188/Sq Ft
Est. Value
About This Home
This home is located at 205 Cornell Ct, Villa Rica, GA 30180 and is currently estimated at $272,145, approximately $188 per square foot. 205 Cornell Ct is a home located in Carroll County with nearby schools including Glanton-Hindsman Elementary School, Villa Rica Middle School, and Villa Rica High School.
Ownership History
Date
Name
Owned For
Owner Type
Purchase Details
Closed on
Oct 10, 2006
Sold by
Trochesset Erica L
Bought by
Stone Beverly G
Current Estimated Value
Home Financials for this Owner
Home Financials are based on the most recent Mortgage that was taken out on this home.
Original Mortgage
$112,000
Outstanding Balance
$66,574
Interest Rate
6.39%
Mortgage Type
New Conventional
Estimated Equity
$205,571
Purchase Details
Closed on
Feb 24, 2003
Sold by
Trochesset Wayne L
Bought by
Trochesset Wayne L and Trochesset Erica L
Purchase Details
Closed on
Aug 2, 2000
Sold by
Tuggle Homes Inc
Bought by
Trochesset Wayne L
Purchase Details
Closed on
Dec 2, 1999
Sold by
Avalon Dev Inc
Bought by
Tuggle Homes Inc
Purchase Details
Closed on
Apr 7, 1999
Sold by
Matthews Matthews and Matthews Bell
Bought by
B & W Dev
Create a Home Valuation Report for This Property
The Home Valuation Report is an in-depth analysis detailing your home's value as well as a comparison with similar homes in the area
Home Values in the Area
Average Home Value in this Area
Purchase History
| Date | Buyer | Sale Price | Title Company |
|---|---|---|---|
| Stone Beverly G | $140,000 | -- | |
| Trochesset Wayne L | -- | -- | |
| Trochesset Wayne L | $106,600 | -- | |
| Tuggle Homes Inc | $18,800 | -- | |
| Avalon Dev Inc | $134,400 | -- | |
| Fields Jerry N | $103,200 | -- | |
| B & W Dev | -- | -- |
Source: Public Records
Mortgage History
| Date | Status | Borrower | Loan Amount |
|---|---|---|---|
| Open | Stone Beverly G | $112,000 |
Source: Public Records
Tax History Compared to Growth
Tax History
| Year | Tax Paid | Tax Assessment Tax Assessment Total Assessment is a certain percentage of the fair market value that is determined by local assessors to be the total taxable value of land and additions on the property. | Land | Improvement |
|---|---|---|---|---|
| 2024 | $2,175 | $96,143 | $8,000 | $88,143 |
| 2023 | $2,175 | $88,812 | $8,000 | $80,812 |
| 2022 | $1,826 | $72,820 | $8,000 | $64,820 |
| 2021 | $1,629 | $63,523 | $8,000 | $55,523 |
| 2020 | $1,482 | $57,748 | $8,000 | $49,748 |
| 2019 | $1,382 | $53,400 | $8,000 | $45,400 |
| 2018 | $1,254 | $47,738 | $8,000 | $39,738 |
| 2017 | $1,247 | $47,338 | $8,000 | $39,338 |
| 2016 | $1,247 | $47,338 | $8,000 | $39,338 |
| 2015 | $1,122 | $40,108 | $8,000 | $32,109 |
| 2014 | $1,126 | $40,109 | $8,000 | $32,109 |
Source: Public Records
Map
Nearby Homes
- 213 Cornell Ct
- 337 Cranmore Place
- 104 Dalton Dr
- 178 Cedars Glen Cir
- 436 Abbey Place
- 100 Cedars Glen Cir
- 232 Harlan Heights Rd
- 101 Cedars Glen Cir
- 1052 Harlan Lane Rd
- 504 Iris Way
- 227 Cedars Glen Cir
- 17 Cedars Glen Place
- 37 Tapley Rd
- 1905 Rockmart Rd
- 132 Hunters Lake Dr
- 275 Cedars Glen Cir
- 281 Cedars Glen Cir
- 209 Cornell Ct
- 129 Harvard Dr
- 125 Harvard Dr
- 206 Cornell Ct
- 210 Cornell Ct
- 210 Cornell Ct Unit 24
- 121 Harvard Dr
- 202 Cornell Ct
- 128 Harvard Dr
- 0 Cornell Ct
- 124 Harvard Dr
- 0 Harvard Dr Unit 7140539
- 0 Harvard Dr Unit 7133576
- 0 Harvard Dr Unit 7197951
- 0 Harvard Dr Unit 7400917
- 0 Harvard Dr Unit 8206767
- 0 Harvard Dr Unit 8472621
- 198 Cornell Ct
- 214 Cornell Ct
- 217 Cornell Ct