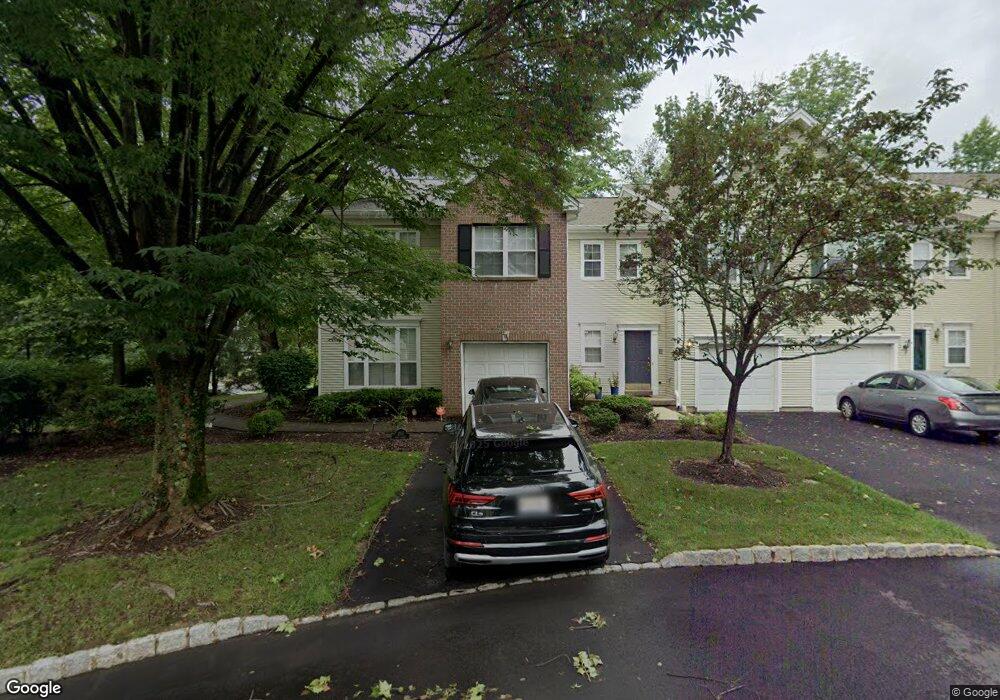
205 Crest Stone Cir Princeton, NJ 08540
Estimated Value: $700,000 - $736,000
3
Beds
3
Baths
1,960
Sq Ft
$365/Sq Ft
Est. Value
About This Home
This home is located at 205 Crest Stone Cir, Princeton, NJ 08540 and is currently estimated at $714,876, approximately $364 per square foot. 205 Crest Stone Cir is a home located in Middlesex County with nearby schools including Cambridge Elementary School, Crossroads South Middle School, and South Brunswick High School.
Ownership History
Date
Name
Owned For
Owner Type
Purchase Details
Closed on
Jun 13, 2023
Sold by
Dhiman Amanpreet Singh and Dhiman Jasmeen
Bought by
Sinha Saharsh and Singh Sneha
Current Estimated Value
Home Financials for this Owner
Home Financials are based on the most recent Mortgage that was taken out on this home.
Original Mortgage
$569,600
Outstanding Balance
$552,895
Interest Rate
5.88%
Mortgage Type
New Conventional
Estimated Equity
$161,981
Purchase Details
Closed on
Sep 1, 2017
Sold by
Dhingra Deepali and Dhingra Ravi Dhingra
Bought by
Dhiman Amanpreet S and Kaur Jasmeen
Home Financials for this Owner
Home Financials are based on the most recent Mortgage that was taken out on this home.
Interest Rate
3.82%
Purchase Details
Closed on
Aug 31, 2005
Sold by
Kumar Nagarajan
Bought by
Dhingra Ravi and Dhingra Deepali
Home Financials for this Owner
Home Financials are based on the most recent Mortgage that was taken out on this home.
Original Mortgage
$359,650
Interest Rate
5.92%
Mortgage Type
New Conventional
Purchase Details
Closed on
May 18, 1999
Sold by
Model Funding
Bought by
Kumar Nagarajan and Kumar Vijaya
Home Financials for this Owner
Home Financials are based on the most recent Mortgage that was taken out on this home.
Original Mortgage
$225,850
Interest Rate
7.54%
Create a Home Valuation Report for This Property
The Home Valuation Report is an in-depth analysis detailing your home's value as well as a comparison with similar homes in the area
Home Values in the Area
Average Home Value in this Area
Purchase History
| Date | Buyer | Sale Price | Title Company |
|---|---|---|---|
| Sinha Saharsh | $640,000 | Foundation Title | |
| Dhiman Amanpreet S | $460,000 | -- | |
| Dhingra Ravi | $495,000 | -- | |
| Kumar Nagarajan | $237,757 | -- |
Source: Public Records
Mortgage History
| Date | Status | Borrower | Loan Amount |
|---|---|---|---|
| Open | Sinha Saharsh | $569,600 | |
| Previous Owner | Dhiman Amanpreet S | -- | |
| Previous Owner | Dhingra Ravi | $359,650 | |
| Previous Owner | Kumar Nagarajan | $225,850 |
Source: Public Records
Tax History Compared to Growth
Tax History
| Year | Tax Paid | Tax Assessment Tax Assessment Total Assessment is a certain percentage of the fair market value that is determined by local assessors to be the total taxable value of land and additions on the property. | Land | Improvement |
|---|---|---|---|---|
| 2025 | $10,715 | $196,300 | $60,000 | $136,300 |
| 2024 | $10,310 | $195,600 | $60,000 | $135,600 |
| 2023 | $10,310 | $195,600 | $60,000 | $135,600 |
| 2022 | $10,001 | $195,600 | $60,000 | $135,600 |
| 2021 | $7,689 | $195,600 | $60,000 | $135,600 |
| 2020 | $10,052 | $195,600 | $60,000 | $135,600 |
| 2019 | $10,140 | $195,600 | $60,000 | $135,600 |
| 2018 | $9,796 | $195,600 | $60,000 | $135,600 |
| 2017 | $9,780 | $195,600 | $60,000 | $135,600 |
| 2016 | $9,659 | $195,600 | $60,000 | $135,600 |
| 2015 | $9,326 | $195,600 | $60,000 | $135,600 |
| 2014 | $9,178 | $195,600 | $60,000 | $135,600 |
Source: Public Records
Map
Nearby Homes
- 70 Coriander Dr
- 50 Coriander Dr
- 12 Caraway Ct
- 16 Tanner Dr
- 1 Cranberry Ct
- 27 Taylor Rd
- 14 Hardwick Dr
- 124 Kingsland Cir
- 118 Andover Dr
- 20 Bellingham Dr
- 1310 Bradley Ct
- 13 Aspen Ct Unit 20E
- 609 Bradley Ct
- 77 Andover Dr
- 72 Fair Acres Ct
- 2502 Pheasant Run
- 2 Fernwood Dr
- 4271 Route 27
- 4489 Route 27
- 836 Ridge Rd
- 205 Creststone Cir
- 204 Creststone Cir
- 203 Creststone Cir
- 202 Creststone Cir
- 201 Creststone Cir
- 302 Creststone Cir
- 302 Crest Stone Cir
- 303 Creststone Cir
- 303 Crest Stone Cir
- 105 Creststone Cir
- 105 Crest Stone Cir
- 104 Creststone Cir
- 401 Creststone Cir
- 401 Crest Stone Cir
- 403 Crest Stone Cir
- 402 Creststone Cir
- 605 Creststone Cir
- 103 Creststone Cir
- 103 Crest Stone Cir
- 403 Creststone Cir Unit C1