205 Cross Bow St Sheridan, IN 46069
Estimated Value: $226,000 - $279,000
3
Beds
3
Baths
1,564
Sq Ft
$167/Sq Ft
Est. Value
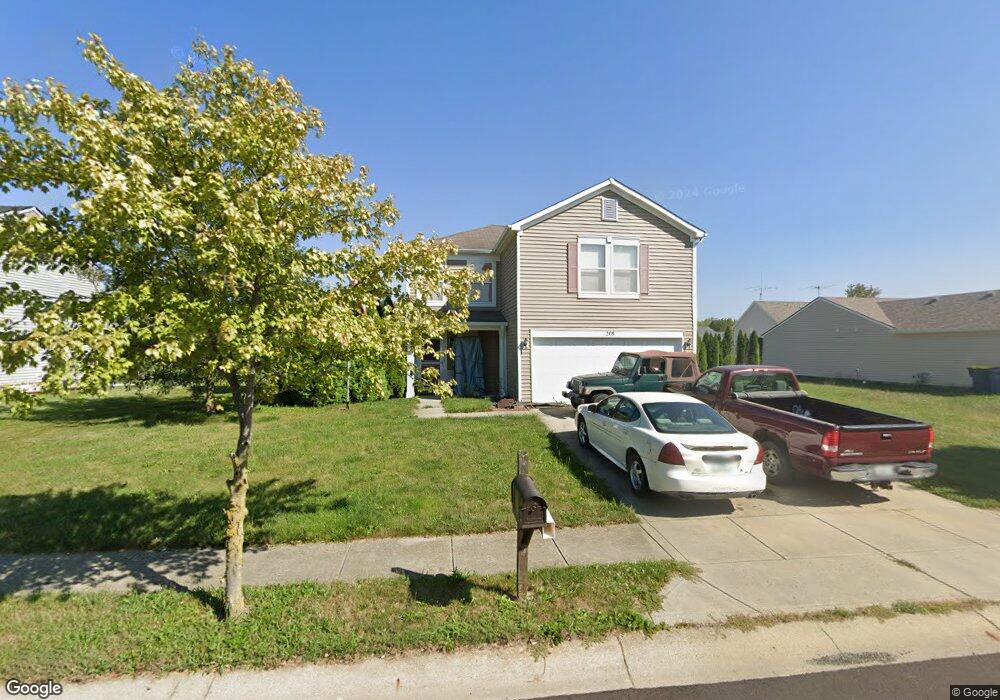
About This Home
This home is located at 205 Cross Bow St, Sheridan, IN 46069 and is currently estimated at $261,934, approximately $167 per square foot. 205 Cross Bow St is a home located in Hamilton County with nearby schools including Sheridan Elementary School, Sheridan Middle School, and Sheridan High School.
Ownership History
Date
Name
Owned For
Owner Type
Purchase Details
Closed on
Jun 12, 2008
Sold by
Connolly Howard
Bought by
Hm/Be Connolly Llc
Current Estimated Value
Purchase Details
Closed on
Apr 7, 2008
Sold by
Hud
Bought by
Connolly Howard
Purchase Details
Closed on
Dec 10, 2007
Sold by
Citimortgage Inc
Bought by
Hud
Purchase Details
Closed on
Sep 17, 2007
Sold by
Waters Jerry L and Waters Mirinda S
Bought by
Citimortgage Inc
Purchase Details
Closed on
Sep 26, 2005
Sold by
C P Morgan Communities Lp
Bought by
Waters Jerry L and Waters Mirinda S
Home Financials for this Owner
Home Financials are based on the most recent Mortgage that was taken out on this home.
Original Mortgage
$118,763
Interest Rate
5.93%
Mortgage Type
FHA
Purchase Details
Closed on
Jun 15, 2005
Sold by
R & B Developers Inc
Bought by
C P Morgan Communities Lp
Purchase Details
Closed on
Jan 22, 2002
Sold by
R & B Developers Llc
Bought by
R & B Developers Inc
Create a Home Valuation Report for This Property
The Home Valuation Report is an in-depth analysis detailing your home's value as well as a comparison with similar homes in the area
Home Values in the Area
Average Home Value in this Area
Purchase History
| Date | Buyer | Sale Price | Title Company |
|---|---|---|---|
| Hm/Be Connolly Llc | -- | None Available | |
| Connolly Howard | -- | Village Title Inc | |
| Hud | -- | None Available | |
| Citimortgage Inc | $127,630 | None Available | |
| Waters Jerry L | -- | -- | |
| C P Morgan Communities Lp | -- | -- | |
| R & B Developers Inc | -- | -- |
Source: Public Records
Mortgage History
| Date | Status | Borrower | Loan Amount |
|---|---|---|---|
| Previous Owner | Waters Jerry L | $118,763 |
Source: Public Records
Tax History Compared to Growth
Tax History
| Year | Tax Paid | Tax Assessment Tax Assessment Total Assessment is a certain percentage of the fair market value that is determined by local assessors to be the total taxable value of land and additions on the property. | Land | Improvement |
|---|---|---|---|---|
| 2024 | $4,446 | $195,700 | $37,200 | $158,500 |
| 2023 | $4,481 | $197,600 | $37,200 | $160,400 |
| 2022 | $3,613 | $159,000 | $37,200 | $121,800 |
| 2021 | $3,241 | $142,500 | $37,200 | $105,300 |
| 2020 | $3,014 | $132,400 | $37,200 | $95,200 |
| 2019 | $2,697 | $118,300 | $17,200 | $101,100 |
| 2018 | $2,503 | $109,700 | $17,200 | $92,500 |
| 2017 | $2,193 | $95,900 | $17,200 | $78,700 |
| 2016 | $2,172 | $97,600 | $17,200 | $80,400 |
| 2014 | $2,199 | $100,400 | $26,100 | $74,300 |
| 2013 | $2,199 | $94,100 | $26,100 | $68,000 |
Source: Public Records
Map
Nearby Homes
- 511 Tomahawk St
- 1102 Maple Run Dr
- 1134 Maple Trace Way
- 1224 Maple Trace Way
- 3936 W State Road 47
- 1225 Maple Trace Way
- 1300 Shadetree Ln
- 413 Shadetree Ct
- 407 W 8th St
- 907 S Ohio St
- 21650 Mule Barn Rd
- 414 Elm Ave
- 707 S Hamilton Ave
- Spruce Plan at Maple Run
- Chestnut Plan at Maple Run
- Juniper Plan at Maple Run
- Empress Plan at Maple Run
- Aspen II Plan at Maple Run
- Ironwood Plan at Maple Run
- Bradford Plan at Maple Run
- 203 Cross Bow St
- 207 Cross Bow St
- 207 Crossbow St
- 104 Arrowhead St
- 102 Arrowhead St
- 102 Arrowhead St Unit 10
- 106 Arrowhead St
- 209 Cross Bow St
- 204 Crossbow St
- 209 Crossbow St
- 204 Cross Bow St
- 206 Cross Bow St
- 202 Crossbow St
- 202 Cross Bow St
- 506 Tomahawk St
- 16 Arrowhead St
- 4 Arrowhead St
- 108 Arrowhead St
- 100 Arrowhead St
- 208 Cross Bow St