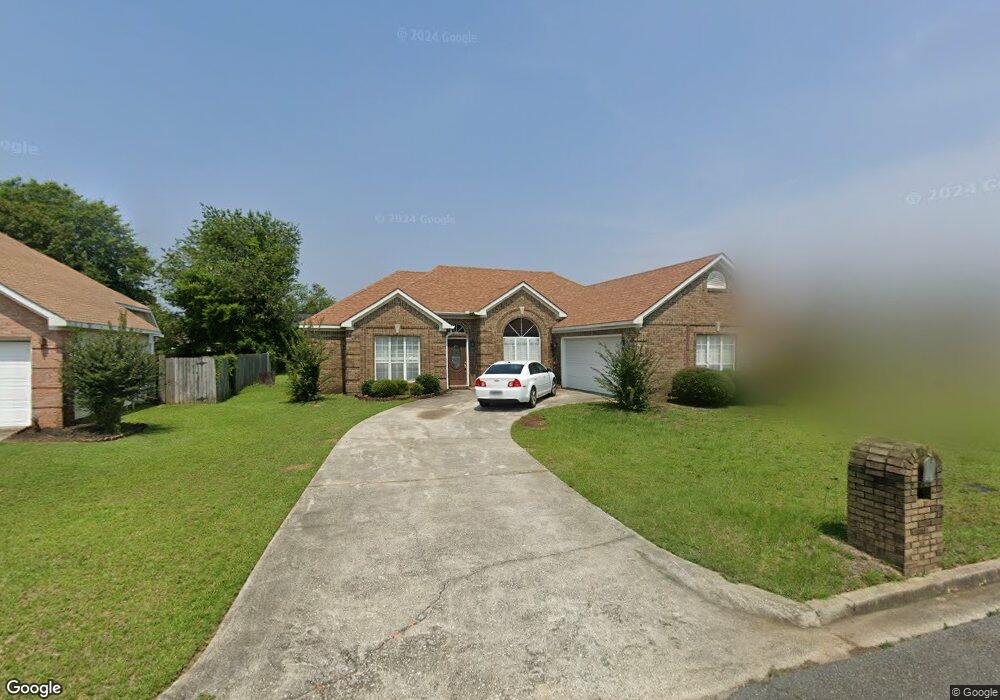
205 Cross Creek Way Warner Robins, GA 31088
Estimated Value: $245,000 - $262,660
--
Bed
1
Bath
1,767
Sq Ft
$144/Sq Ft
Est. Value
About This Home
This home is located at 205 Cross Creek Way, Warner Robins, GA 31088 and is currently estimated at $254,415, approximately $143 per square foot. 205 Cross Creek Way is a home located in Houston County with nearby schools including Russell Elementary School, Huntington Middle School, and Warner Robins High School.
Ownership History
Date
Name
Owned For
Owner Type
Purchase Details
Closed on
Jun 30, 2010
Sold by
Bundick Milton W
Bought by
Bundick Milton W and Bundick Judy C
Current Estimated Value
Home Financials for this Owner
Home Financials are based on the most recent Mortgage that was taken out on this home.
Original Mortgage
$145,000
Outstanding Balance
$96,691
Interest Rate
4.79%
Mortgage Type
VA
Estimated Equity
$157,724
Purchase Details
Closed on
Mar 31, 2003
Sold by
Walsh Bernard J and Walsh Monica*
Bought by
Walsh Monica
Purchase Details
Closed on
Oct 24, 1995
Sold by
Swan Homes Inc
Bought by
Walsh Bernard J and Walsh Monica*
Purchase Details
Closed on
Apr 12, 1995
Sold by
Georgia Houston Properties Inc
Bought by
Swan Homes Inc
Purchase Details
Closed on
Jun 30, 1994
Sold by
Schwanebeck William L
Bought by
Georgia Houston Properties Inc
Create a Home Valuation Report for This Property
The Home Valuation Report is an in-depth analysis detailing your home's value as well as a comparison with similar homes in the area
Home Values in the Area
Average Home Value in this Area
Purchase History
| Date | Buyer | Sale Price | Title Company |
|---|---|---|---|
| Bundick Milton W | -- | None Available | |
| Bundick Milton W | $145,000 | None Available | |
| Walsh Monica | -- | -- | |
| Walsh Bernard J | $107,800 | -- | |
| Swan Homes Inc | $15,000 | -- | |
| Georgia Houston Properties Inc | -- | -- |
Source: Public Records
Mortgage History
| Date | Status | Borrower | Loan Amount |
|---|---|---|---|
| Open | Bundick Milton W | $145,000 |
Source: Public Records
Tax History Compared to Growth
Tax History
| Year | Tax Paid | Tax Assessment Tax Assessment Total Assessment is a certain percentage of the fair market value that is determined by local assessors to be the total taxable value of land and additions on the property. | Land | Improvement |
|---|---|---|---|---|
| 2024 | -- | $77,840 | $6,400 | $71,440 |
| 2023 | $0 | $62,800 | $6,400 | $56,400 |
| 2022 | $1,882 | $57,080 | $6,400 | $50,680 |
| 2021 | $1,189 | $53,440 | $6,400 | $47,040 |
| 2020 | $1,121 | $50,240 | $6,400 | $43,840 |
| 2019 | $1,121 | $50,240 | $6,400 | $43,840 |
| 2018 | $1,121 | $50,240 | $6,400 | $43,840 |
| 2017 | $1,122 | $50,240 | $6,400 | $43,840 |
| 2016 | $1,124 | $50,240 | $6,400 | $43,840 |
| 2015 | -- | $50,240 | $6,400 | $43,840 |
| 2014 | -- | $50,240 | $6,400 | $43,840 |
| 2013 | -- | $50,240 | $6,400 | $43,840 |
Source: Public Records
Map
Nearby Homes
- 111 Raintree Dr
- LOT 25 & 26 Plantation Dr
- 207 Summer Hill Place
- 300 Summer Hill Place
- 105 International Blvd
- 201 Beaver Run Dr
- 202 Lake Front Dr
- 314 Air View Dr Unit 8
- 314 Air View Dr
- 105 Leisure Lake Ct
- 103 Leisure Lake Ct
- 101 Leisure Lake Ct
- 422 Lake Front Dr
- 108 Pheasant Cove
- 101 S Oaks Ln
- 330 Hidden Creek Cir
- 106 Mulligan Ct
- 102 Tallulah Trail
- 217 Station Way
- 122 Tallulah Trail
- 203 Cross Creek Way
- 207 Cross Creek Way
- 507 Pebblebrook W
- 509 Pebblebrook W
- 209 Cross Creek Way
- 501 Pebblebrook W
- 503 Pebblebrook W
- 207 Pebblebrook E Unit 10
- 207 Pebblebrook E
- 511 Pebblebrook W
- 206 Pebblebrook E
- 505 Pebblebrook W
- 403 Pebblebrook E
- 301 Cross Creek Way
- 513 Pebblebrook W
- 205 Pebblebrook E
- 204 Pebblebrook E
- 405 Pebblebrook E
- 302 Cross Creek Way
- 502 Pebblebrook W