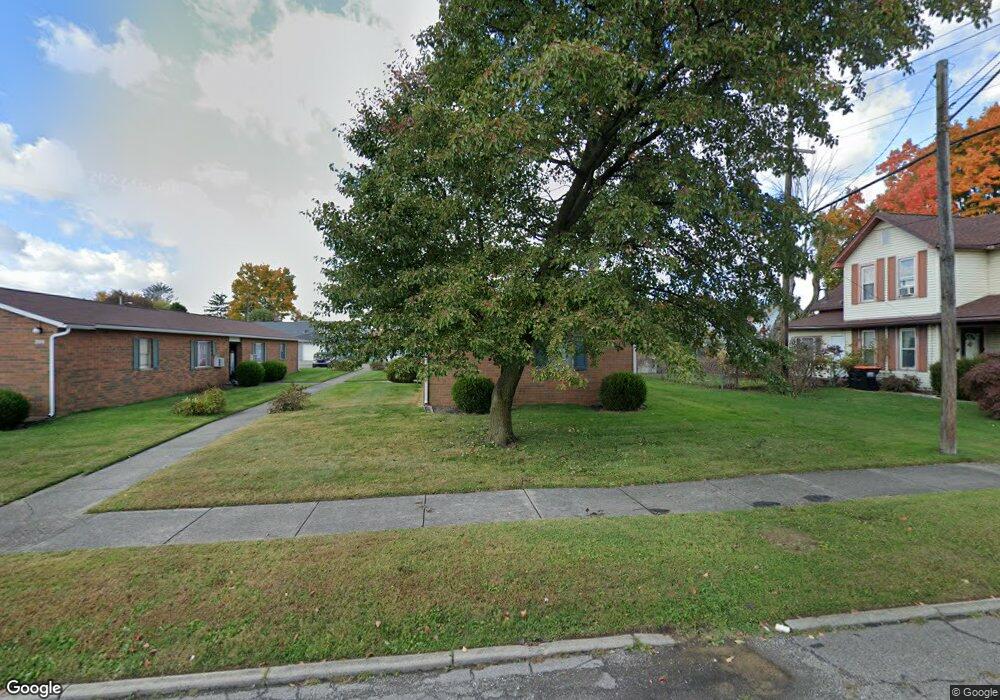
205 Decrow Ave Newark, OH 43055
Estimated Value: $144,339 - $204,000
4
Beds
2
Baths
1,816
Sq Ft
$94/Sq Ft
Est. Value
About This Home
This home is located at 205 Decrow Ave, Newark, OH 43055 and is currently estimated at $170,085, approximately $93 per square foot. 205 Decrow Ave is a home located in Licking County with nearby schools including Mcguffey Elementary School, Wilson Middle School, and Newark High School.
Ownership History
Date
Name
Owned For
Owner Type
Purchase Details
Closed on
Jul 12, 2011
Sold by
Rjck Properties Llc
Bought by
Ging Investments Llc
Current Estimated Value
Home Financials for this Owner
Home Financials are based on the most recent Mortgage that was taken out on this home.
Original Mortgage
$140,000
Outstanding Balance
$10,505
Interest Rate
4.52%
Mortgage Type
Future Advance Clause Open End Mortgage
Estimated Equity
$159,580
Purchase Details
Closed on
Mar 20, 2007
Sold by
Jones Ronald J and Kennedy Carol A
Bought by
The Rjck Properties Llc
Purchase Details
Closed on
Jun 2, 2000
Sold by
Mcgee Lewis A
Bought by
Jones Ronald J and Kennedy Carol W
Home Financials for this Owner
Home Financials are based on the most recent Mortgage that was taken out on this home.
Original Mortgage
$90,000
Interest Rate
8.18%
Mortgage Type
New Conventional
Create a Home Valuation Report for This Property
The Home Valuation Report is an in-depth analysis detailing your home's value as well as a comparison with similar homes in the area
Home Values in the Area
Average Home Value in this Area
Purchase History
| Date | Buyer | Sale Price | Title Company |
|---|---|---|---|
| Ging Investments Llc | $175,000 | Attorney | |
| The Rjck Properties Llc | -- | Attorney | |
| Jones Ronald J | $100,000 | -- |
Source: Public Records
Mortgage History
| Date | Status | Borrower | Loan Amount |
|---|---|---|---|
| Open | Ging Investments Llc | $140,000 | |
| Previous Owner | Jones Ronald J | $90,000 |
Source: Public Records
Tax History
| Year | Tax Paid | Tax Assessment Tax Assessment Total Assessment is a certain percentage of the fair market value that is determined by local assessors to be the total taxable value of land and additions on the property. | Land | Improvement |
|---|---|---|---|---|
| 2024 | $1,627 | $44,390 | $10,960 | $33,430 |
| 2023 | $1,626 | $44,390 | $10,960 | $33,430 |
| 2022 | $1,251 | $30,520 | $6,580 | $23,940 |
| 2021 | $1,313 | $30,520 | $6,580 | $23,940 |
| 2020 | $1,343 | $30,520 | $6,580 | $23,940 |
| 2019 | $1,093 | $23,910 | $5,500 | $18,410 |
| 2018 | $1,093 | $0 | $0 | $0 |
| 2017 | $1,237 | $0 | $0 | $0 |
| 2016 | $1,391 | $0 | $0 | $0 |
| 2015 | $1,422 | $0 | $0 | $0 |
| 2014 | $1,781 | $0 | $0 | $0 |
| 2013 | $1,395 | $0 | $0 | $0 |
Source: Public Records
Map
Nearby Homes
- 452 Saint James Gate
- 132 Cambria St
- 149 Maholm St
- 114-116 Maholm St
- 30 Neal Ave
- 606 W Main St
- 915 W Main St
- 224 Walden Rd
- 389 Kells Ct E
- 384 Kells Ct E
- 148 N 21st St
- 42 Union St
- 139 N 26th St
- 231 Fieldpoint Rd
- 67 N 31st St
- 514 S 30th St
- 377 Saint James Gate
- 346 W Main St
- 645 Kensington Dr Unit 645
- 0 Jefferson St
Your Personal Tour Guide
Ask me questions while you tour the home.