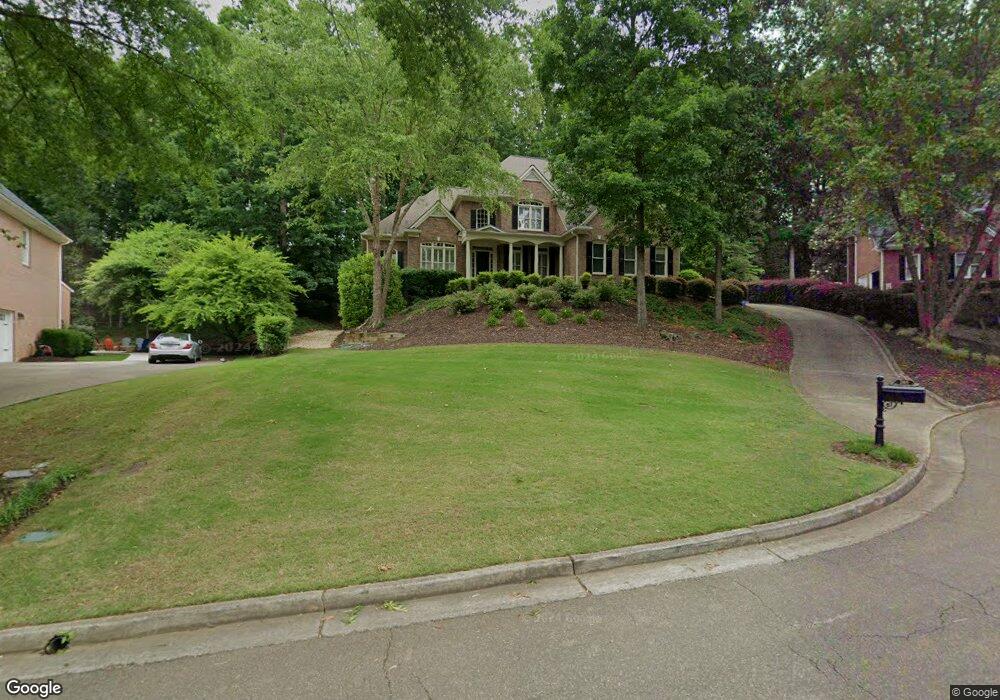
205 Devonshire Ct Canton, GA 30115
Union Hill NeighborhoodEstimated Value: $791,146 - $1,118,000
5
Beds
5
Baths
4,265
Sq Ft
$224/Sq Ft
Est. Value
About This Home
This home is located at 205 Devonshire Ct, Canton, GA 30115 and is currently estimated at $954,573, approximately $223 per square foot. 205 Devonshire Ct is a home located in Cherokee County with nearby schools including Macedonia Elementary School, Creekland Middle School, and Creekview High School.
Ownership History
Date
Name
Owned For
Owner Type
Purchase Details
Closed on
Aug 26, 2014
Sold by
Lewis Brian J
Bought by
Lewis Susan R Thompson
Current Estimated Value
Purchase Details
Closed on
Jun 15, 2010
Sold by
Turner Michael G and Turner Karen P
Bought by
Lewis Brian J
Purchase Details
Closed on
May 27, 2005
Sold by
Korak Lawrence G
Bought by
Turner Michael G and Turner Karen
Home Financials for this Owner
Home Financials are based on the most recent Mortgage that was taken out on this home.
Original Mortgage
$393,500
Interest Rate
5.5%
Mortgage Type
New Conventional
Purchase Details
Closed on
Oct 28, 1999
Sold by
John Wieland Homes Inc
Bought by
Korak Lawrence G
Home Financials for this Owner
Home Financials are based on the most recent Mortgage that was taken out on this home.
Original Mortgage
$345,600
Interest Rate
7.25%
Mortgage Type
New Conventional
Create a Home Valuation Report for This Property
The Home Valuation Report is an in-depth analysis detailing your home's value as well as a comparison with similar homes in the area
Home Values in the Area
Average Home Value in this Area
Purchase History
| Date | Buyer | Sale Price | Title Company |
|---|---|---|---|
| Lewis Susan R Thompson | -- | -- | |
| Lewis Brian J | $419,500 | -- | |
| Turner Michael G | $492,000 | -- | |
| Korak Lawrence G | $432,100 | -- |
Source: Public Records
Mortgage History
| Date | Status | Borrower | Loan Amount |
|---|---|---|---|
| Previous Owner | Turner Michael G | $393,500 | |
| Previous Owner | Korak Lawrence G | $345,600 |
Source: Public Records
Tax History
| Year | Tax Paid | Tax Assessment Tax Assessment Total Assessment is a certain percentage of the fair market value that is determined by local assessors to be the total taxable value of land and additions on the property. | Land | Improvement |
|---|---|---|---|---|
| 2025 | $1,822 | $309,520 | $54,000 | $255,520 |
| 2024 | $3,287 | $285,560 | $50,000 | $235,560 |
| 2023 | $2,921 | $283,520 | $44,800 | $238,720 |
| 2022 | $2,674 | $234,680 | $43,200 | $191,480 |
| 2021 | $2,151 | $194,520 | $28,000 | $166,520 |
| 2020 | $2,050 | $188,160 | $28,000 | $160,160 |
| 2019 | $5,179 | $182,280 | $28,000 | $154,280 |
| 2018 | $4,935 | $172,640 | $28,000 | $144,640 |
| 2017 | $4,830 | $419,100 | $28,000 | $139,640 |
| 2016 | $4,776 | $410,100 | $28,000 | $136,040 |
| 2015 | $4,871 | $414,200 | $28,000 | $137,680 |
| 2014 | $4,572 | $388,000 | $28,000 | $127,200 |
Source: Public Records
Map
Nearby Homes
- 110 Grandmar Chase
- 900 Ravenwood Way
- 211 Wilde Oak Ct
- 402 Greyfield Dr
- 213 Haley Farm Way
- 404 Greyfield Dr
- 420 Greyfield Dr
- 441 Tanglewood Dr
- 504 Stillbrook Ct
- 142 Grandmar Chase
- 336 Tanglewood Dr
- 176 Grandmar Chase Unit 8B
- 114 Ridgemoor Trace
- 446 Greyfield Dr
- 248 Cedarhurst Dr
- 507 Prestwyck Haven
- 208 Grandmar Chase
- 2203 Arbor Hill Rd
- 205 Carrington Point
- 417 Farmwood Way
- 205 Devonshire Ct
- 203 Devonshire Ct
- 207 Devonshire Ct
- 202 Devonshire Ct Unit 1A
- 209 Devonshire Ct
- 201 Devonshire Ct Unit 1A
- 204 Devonshire Ct
- 115 Grand Oaks Dr
- 108 Grandmar Chase
- 200 Devonshire Ct Unit 1A
- 111 Grand Oaks Dr
- 113 Grand Oaks Dr
- 117 Grand Oaks Dr
- 109 Grand Oaks Dr
- 110 Grandmar Chase Unit 110
- 110 Grandmar Chase Unit 1A
- 102 Grandmar Chase Unit 1A
- 119 Grand Oaks Dr
- 2084 Gaddis Rd
- 107 Grand Oaks Dr
Your Personal Tour Guide
Ask me questions while you tour the home.