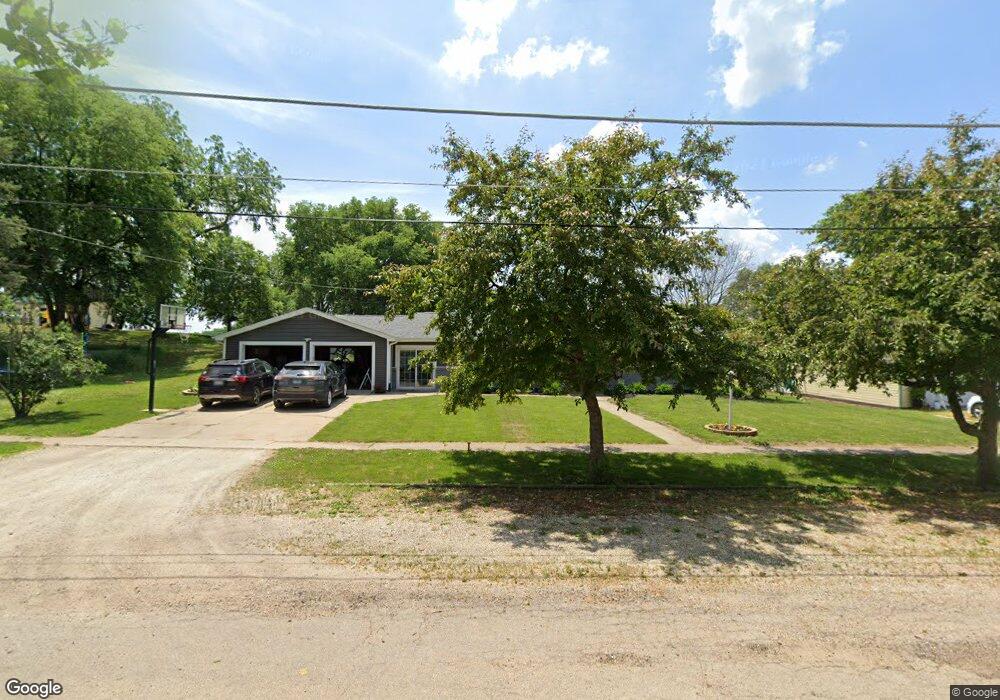
205 Douglas St Prophetstown, IL 61277
Estimated Value: $135,000 - $178,606
3
Beds
--
Bath
1,380
Sq Ft
$109/Sq Ft
Est. Value
About This Home
This home is located at 205 Douglas St, Prophetstown, IL 61277 and is currently estimated at $150,152, approximately $108 per square foot. 205 Douglas St is a home located in Whiteside County with nearby schools including Prophetstown High School.
Ownership History
Date
Name
Owned For
Owner Type
Purchase Details
Closed on
Oct 15, 2021
Sold by
Stralow Nathan A
Bought by
Kubatzke James R and Kubatzke Roxanne J
Current Estimated Value
Home Financials for this Owner
Home Financials are based on the most recent Mortgage that was taken out on this home.
Original Mortgage
$110,000
Outstanding Balance
$100,310
Interest Rate
2.8%
Mortgage Type
Purchase Money Mortgage
Estimated Equity
$49,842
Purchase Details
Closed on
Jul 1, 2003
Bought by
Stralow Nathan A
Create a Home Valuation Report for This Property
The Home Valuation Report is an in-depth analysis detailing your home's value as well as a comparison with similar homes in the area
Home Values in the Area
Average Home Value in this Area
Purchase History
| Date | Buyer | Sale Price | Title Company |
|---|---|---|---|
| Kubatzke James R | $156,500 | None Available | |
| Stralow Nathan A | $79,900 | -- |
Source: Public Records
Mortgage History
| Date | Status | Borrower | Loan Amount |
|---|---|---|---|
| Open | Kubatzke James R | $110,000 |
Source: Public Records
Tax History Compared to Growth
Tax History
| Year | Tax Paid | Tax Assessment Tax Assessment Total Assessment is a certain percentage of the fair market value that is determined by local assessors to be the total taxable value of land and additions on the property. | Land | Improvement |
|---|---|---|---|---|
| 2024 | $3,331 | $39,102 | $4,312 | $34,790 |
| 2023 | $3,008 | $35,654 | $3,932 | $31,722 |
| 2022 | $2,719 | $31,400 | $3,463 | $27,937 |
| 2021 | $2,021 | $28,587 | $3,153 | $25,434 |
| 2020 | $2,071 | $28,527 | $3,146 | $25,381 |
| 2019 | $2,294 | $31,138 | $5,074 | $26,064 |
| 2018 | $2,137 | $29,701 | $5,262 | $24,439 |
| 2017 | $2,128 | $29,098 | $5,155 | $23,943 |
| 2016 | $2,103 | $28,103 | $4,979 | $23,124 |
| 2015 | $2,255 | $29,993 | $5,314 | $24,679 |
| 2014 | $2,080 | $28,646 | $5,075 | $23,571 |
| 2013 | $2,255 | $29,993 | $5,314 | $24,679 |
Source: Public Records
Map
Nearby Homes