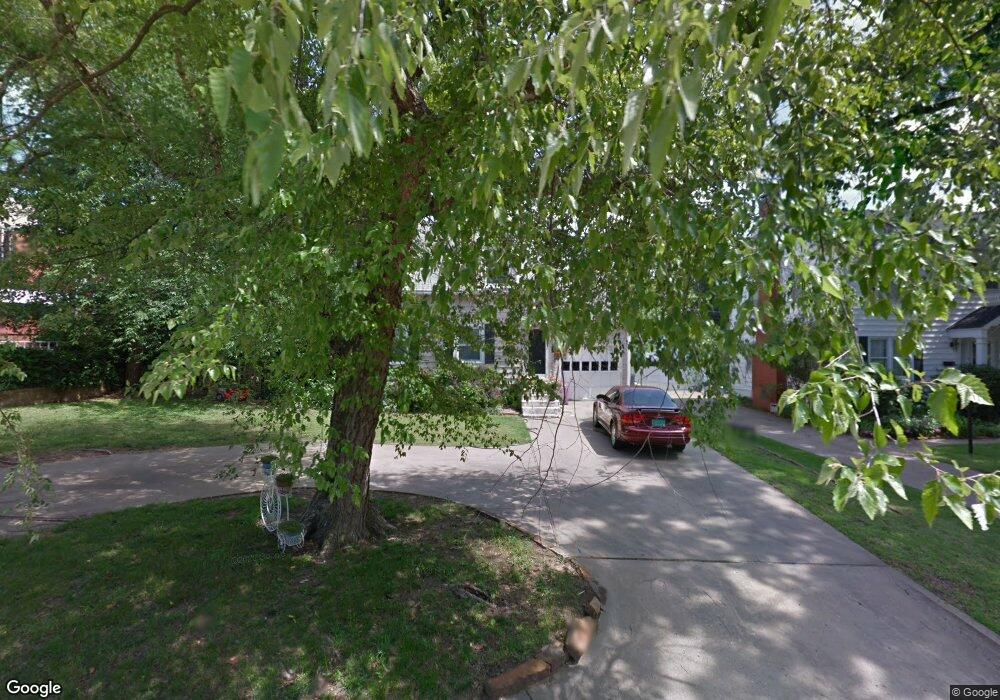
205 E 17th St Bartlesville, OK 74003
Estimated Value: $185,187 - $208,000
4
Beds
3
Baths
1,872
Sq Ft
$104/Sq Ft
Est. Value
About This Home
This home is located at 205 E 17th St, Bartlesville, OK 74003 and is currently estimated at $193,797, approximately $103 per square foot. 205 E 17th St is a home located in Washington County with nearby schools including Richard Kane Elementary School, Central Middle School, and Bartlesville High School.
Ownership History
Date
Name
Owned For
Owner Type
Purchase Details
Closed on
Jun 4, 2015
Sold by
Franks Kyra K
Bought by
Williams Robert L
Current Estimated Value
Purchase Details
Closed on
Jan 20, 2006
Sold by
Walden Danny and Walden Vickie R
Bought by
Williams Kyra Kay and Williams Robertlee
Home Financials for this Owner
Home Financials are based on the most recent Mortgage that was taken out on this home.
Original Mortgage
$120,600
Interest Rate
6.25%
Mortgage Type
New Conventional
Purchase Details
Closed on
Jul 12, 2002
Sold by
Thompson Elizabeth J
Purchase Details
Closed on
Jul 16, 2001
Sold by
Thompson Elizabeth J
Purchase Details
Closed on
Sep 21, 2000
Sold by
Associates Relocation
Purchase Details
Closed on
Aug 25, 2000
Sold by
Leech Brian P and Leech Debbie W
Purchase Details
Closed on
Apr 14, 1998
Sold by
Henley Arthur Alan
Purchase Details
Closed on
Sep 12, 1995
Sold by
Hartsell Brent Dean
Create a Home Valuation Report for This Property
The Home Valuation Report is an in-depth analysis detailing your home's value as well as a comparison with similar homes in the area
Home Values in the Area
Average Home Value in this Area
Purchase History
| Date | Buyer | Sale Price | Title Company |
|---|---|---|---|
| Williams Robert L | -- | None Available | |
| Williams Kyra Kay | $127,000 | None Available | |
| -- | $115,500 | -- | |
| -- | -- | -- | |
| -- | $105,000 | -- | |
| -- | $105,000 | -- | |
| -- | $102,000 | -- | |
| -- | $92,500 | -- |
Source: Public Records
Mortgage History
| Date | Status | Borrower | Loan Amount |
|---|---|---|---|
| Closed | Williams Kyra Kay | $120,600 |
Source: Public Records
Tax History Compared to Growth
Tax History
| Year | Tax Paid | Tax Assessment Tax Assessment Total Assessment is a certain percentage of the fair market value that is determined by local assessors to be the total taxable value of land and additions on the property. | Land | Improvement |
|---|---|---|---|---|
| 2024 | $1,753 | $15,597 | $1,211 | $14,386 |
| 2023 | $1,753 | $15,597 | $1,211 | $14,386 |
| 2022 | $1,709 | $15,267 | $1,211 | $14,056 |
| 2021 | $1,675 | $15,267 | $1,211 | $14,056 |
| 2020 | $1,713 | $15,267 | $1,211 | $14,056 |
| 2019 | $1,714 | $15,267 | $1,211 | $14,056 |
| 2018 | $1,702 | $15,239 | $1,211 | $14,028 |
| 2017 | $1,742 | $15,239 | $1,211 | $14,028 |
| 2016 | $1,635 | $15,239 | $1,211 | $14,028 |
| 2015 | $1,660 | $15,239 | $1,211 | $14,028 |
| 2014 | $1,654 | $15,239 | $1,211 | $14,028 |
Source: Public Records
Map
Nearby Homes
- 1701 S Dewey Ave
- 1628 S Osage Ave
- 1629 S Dewey Ave
- 1655 Cherokee Place
- 1704 Cherokee Pl Place
- 1625 Cherokee Place
- 1704 Cherokee Place
- 1820 Southview Ave
- 526 E 16th St
- 1936 S Johnstone Ave
- 1520 SW Jennings Ave
- 1436 S Keeler Ave
- 1835 S Armstrong Ave
- 2008 S Dewey Ave
- 2251 S Keeler Ave
- 1525 Pecan Place
- 1404 SW Jennings Ave
- 1409 SW Jennings Ave
- 512 W 20th St
- 535 E 14th St
- 201 E 17th St
- 211 E 17th St
- 1716 S Dewey Ave
- 1705 S Osage Ave
- 1715 S Osage Ave
- 200 E 17th St
- 1701 S Osage Ave
- 1720 S Dewey Ave
- 1719 S Osage Ave
- 1724 S Dewey Ave
- 202 E 17th St
- 1723 S Osage Ave
- 1709 S Dewey Ave
- 1700 S Dewey Ave
- 210 E 17th St
- 1717 S Dewey Ave
- 1705 S Dewey Ave
- 1728 S Dewey Ave
- 1727 S Osage Ave
- 220 E 17th St