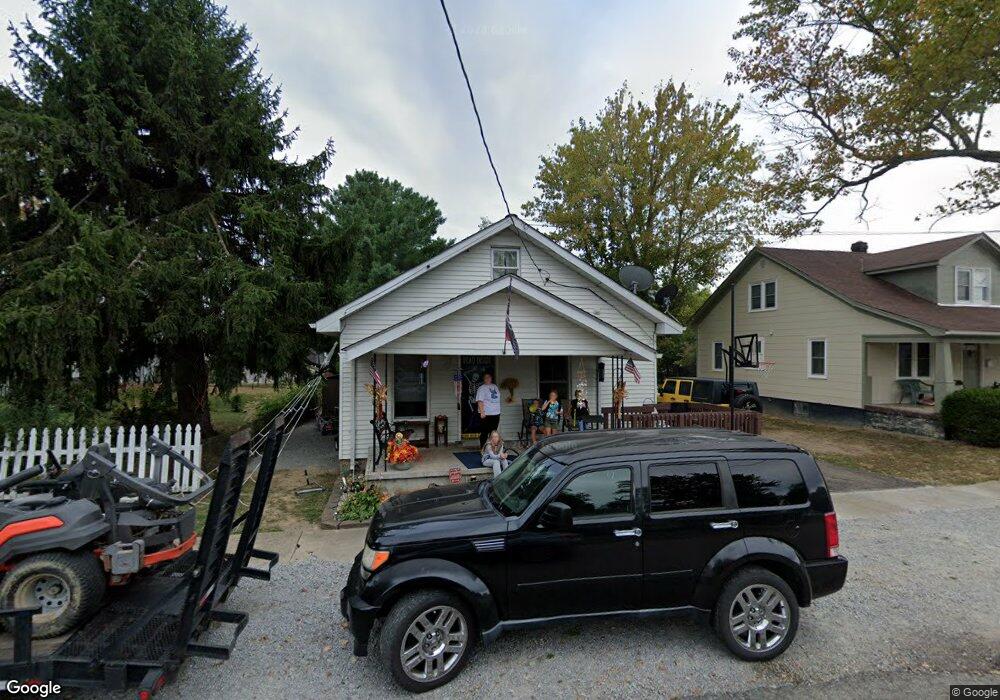
205 E 3rd St Georgetown, OH 45121
Estimated Value: $158,481 - $176,000
3
Beds
2
Baths
1,146
Sq Ft
$147/Sq Ft
Est. Value
About This Home
This home is located at 205 E 3rd St, Georgetown, OH 45121 and is currently estimated at $168,370, approximately $146 per square foot. 205 E 3rd St is a home located in Brown County with nearby schools including Georgetown Elementary School and Georgetown Jr/Sr High School.
Ownership History
Date
Name
Owned For
Owner Type
Purchase Details
Closed on
Feb 28, 2003
Sold by
Grace Rebecca
Bought by
Grace James T and Grace Rebecca
Current Estimated Value
Home Financials for this Owner
Home Financials are based on the most recent Mortgage that was taken out on this home.
Original Mortgage
$91,000
Interest Rate
6%
Mortgage Type
Unknown
Purchase Details
Closed on
Feb 8, 2002
Sold by
South Carol E
Bought by
Grace James T and Grace Rebecca G
Home Financials for this Owner
Home Financials are based on the most recent Mortgage that was taken out on this home.
Original Mortgage
$84,333
Interest Rate
7.24%
Mortgage Type
FHA
Create a Home Valuation Report for This Property
The Home Valuation Report is an in-depth analysis detailing your home's value as well as a comparison with similar homes in the area
Home Values in the Area
Average Home Value in this Area
Purchase History
| Date | Buyer | Sale Price | Title Company |
|---|---|---|---|
| Grace James T | -- | First Class Title Agency Inc | |
| Grace James T | $85,000 | -- |
Source: Public Records
Mortgage History
| Date | Status | Borrower | Loan Amount |
|---|---|---|---|
| Closed | Grace James T | $91,000 | |
| Closed | Grace James T | $84,333 |
Source: Public Records
Tax History
| Year | Tax Paid | Tax Assessment Tax Assessment Total Assessment is a certain percentage of the fair market value that is determined by local assessors to be the total taxable value of land and additions on the property. | Land | Improvement |
|---|---|---|---|---|
| 2024 | $1,081 | $40,680 | $3,360 | $37,320 |
| 2023 | $1,094 | $28,080 | $2,840 | $25,240 |
| 2022 | $745 | $28,080 | $2,840 | $25,240 |
| 2021 | $1,073 | $28,080 | $2,840 | $25,240 |
| 2020 | $950 | $23,410 | $2,380 | $21,030 |
| 2019 | $943 | $23,410 | $2,380 | $21,030 |
| 2018 | $936 | $23,410 | $2,380 | $21,030 |
| 2017 | $746 | $22,140 | $2,080 | $20,060 |
| 2016 | $746 | $22,140 | $2,080 | $20,060 |
| 2015 | $755 | $22,140 | $2,080 | $20,060 |
| 2014 | $781 | $21,950 | $1,890 | $20,060 |
| 2013 | $778 | $21,950 | $1,890 | $20,060 |
Source: Public Records
Map
Nearby Homes
- 505 S Water St
- 405 N Main St
- 406 E North St
- 510 W State St
- 399 Elmwood Ct
- 60 New St
- 666 E State St
- 508 Mount Orab Pike
- 708 E State St
- 155 Free Soil Rd
- 25 Douglas Ln
- 20 Heritage Hill Dr
- 0 St Rt 221 & Footbridge Unit 1826509
- 427 Kenwood Ave
- 1 N Kenwood Ave
- 175 Douglas Cir
- 2 N Kenwood Ave
- 38 Dell Acres Dr
- 470 Free Soil Rd
- 7029 Free Soil Rd
Your Personal Tour Guide
Ask me questions while you tour the home.