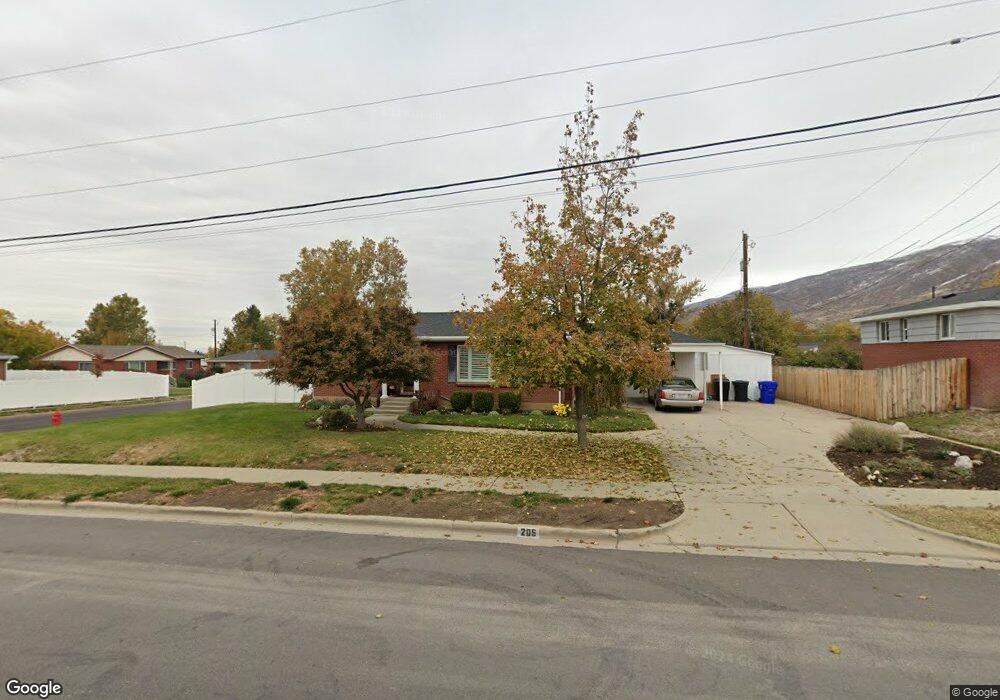
205 E 900 N Bountiful, UT 84010
Estimated Value: $450,000 - $586,000
4
Beds
2
Baths
1,912
Sq Ft
$263/Sq Ft
Est. Value
About This Home
This home is located at 205 E 900 N, Bountiful, UT 84010 and is currently estimated at $503,474, approximately $263 per square foot. 205 E 900 N is a home located in Davis County with nearby schools including Tolman School, Bountiful Junior High School, and Viewmont High School.
Ownership History
Date
Name
Owned For
Owner Type
Purchase Details
Closed on
Aug 13, 2020
Sold by
Foster Brad and Foster Whitney
Bought by
Cash Naomi
Current Estimated Value
Home Financials for this Owner
Home Financials are based on the most recent Mortgage that was taken out on this home.
Original Mortgage
$351,500
Outstanding Balance
$311,103
Interest Rate
3%
Mortgage Type
New Conventional
Estimated Equity
$192,371
Purchase Details
Closed on
Aug 24, 2018
Sold by
Foster Brad
Bought by
Foster Brad and Foster Whitney
Home Financials for this Owner
Home Financials are based on the most recent Mortgage that was taken out on this home.
Original Mortgage
$253,600
Interest Rate
4.5%
Mortgage Type
New Conventional
Purchase Details
Closed on
Apr 30, 2018
Sold by
Pye Beverly D
Bought by
M & L Real Estate
Home Financials for this Owner
Home Financials are based on the most recent Mortgage that was taken out on this home.
Original Mortgage
$154,000
Interest Rate
4.44%
Mortgage Type
New Conventional
Purchase Details
Closed on
Mar 13, 2018
Sold by
Pye Jeffrey M and Pye Beverly D
Bought by
Pye Beverly D
Home Financials for this Owner
Home Financials are based on the most recent Mortgage that was taken out on this home.
Original Mortgage
$154,000
Interest Rate
4.44%
Mortgage Type
New Conventional
Purchase Details
Closed on
Nov 17, 2014
Sold by
Carter Beverly D and Pye Beverly D
Bought by
Pye Jeffrey M and Pye Beverly D
Purchase Details
Closed on
Aug 11, 2010
Sold by
Carter Beverly D
Bought by
Carter Beverly D
Home Financials for this Owner
Home Financials are based on the most recent Mortgage that was taken out on this home.
Original Mortgage
$120,000
Interest Rate
4.52%
Mortgage Type
New Conventional
Purchase Details
Closed on
May 14, 2003
Sold by
Carter Daniel Lyman and Carter Beverly Diane
Bought by
Carter Beverly D
Create a Home Valuation Report for This Property
The Home Valuation Report is an in-depth analysis detailing your home's value as well as a comparison with similar homes in the area
Purchase History
| Date | Buyer | Sale Price | Title Company |
|---|---|---|---|
| Cash Naomi | -- | Pinnacle Title Ins | |
| Foster Brad | -- | Surety Title | |
| Foster Brad | -- | Backman Title | |
| M & L Real Estate | -- | First Americian Title | |
| Pye Beverly D | -- | Backman Title | |
| Pye Jeffrey M | -- | Backman Title Servi | |
| Carter Beverly D | -- | Backman Title Services | |
| Carter Beverly D | -- | Backman Stewart Title Servic |
Source: Public Records
Mortgage History
| Date | Status | Borrower | Loan Amount |
|---|---|---|---|
| Open | Cash Naomi | $351,500 | |
| Previous Owner | Foster Brad | $253,600 | |
| Previous Owner | M & L Real Estate | $154,000 | |
| Previous Owner | Pye Beverly D | $230,000 | |
| Previous Owner | Carter Beverly D | $120,000 |
Source: Public Records
Tax History
| Year | Tax Paid | Tax Assessment Tax Assessment Total Assessment is a certain percentage of the fair market value that is determined by local assessors to be the total taxable value of land and additions on the property. | Land | Improvement |
|---|---|---|---|---|
| 2025 | $2,716 | $246,400 | $118,664 | $127,736 |
| 2024 | $2,531 | $238,699 | $104,020 | $134,679 |
| 2023 | $2,625 | $451,000 | $193,274 | $257,726 |
| 2022 | $2,761 | $260,700 | $106,053 | $154,647 |
| 2021 | $2,541 | $367,000 | $138,713 | $228,287 |
| 2020 | $2,217 | $321,000 | $119,090 | $201,910 |
| 2019 | $2,068 | $291,000 | $129,914 | $161,086 |
| 2018 | $1,741 | $239,000 | $127,883 | $111,117 |
| 2016 | $1,523 | $113,300 | $52,076 | $61,224 |
| 2015 | $1,533 | $107,855 | $52,076 | $55,779 |
| 2014 | -- | $113,891 | $52,076 | $61,815 |
| 2013 | -- | $96,663 | $40,746 | $55,917 |
Source: Public Records
Map
Nearby Homes
- 1420 N Main St
- 453 N 400 E Unit 7-D
- 106 W 700 N
- 184 Park Shadows Cir
- 1130 N 200 W
- 345 N 400 E
- 1260 N 200 W
- 49 E 200 N Unit 4
- 41 E 200 N Unit 6
- 252 N Main St
- 256 N Main St
- 254 N Main St
- 55 E 200 N Unit 2
- 51 E 200 N Unit 3
- 662 E 1200 N
- 967 S Courtyard Ln
- 563 N 200 W
- 499 N 200 W Unit 30
- 235 W 1400 N
- 96 Village Square Rd
Your Personal Tour Guide
Ask me questions while you tour the home.