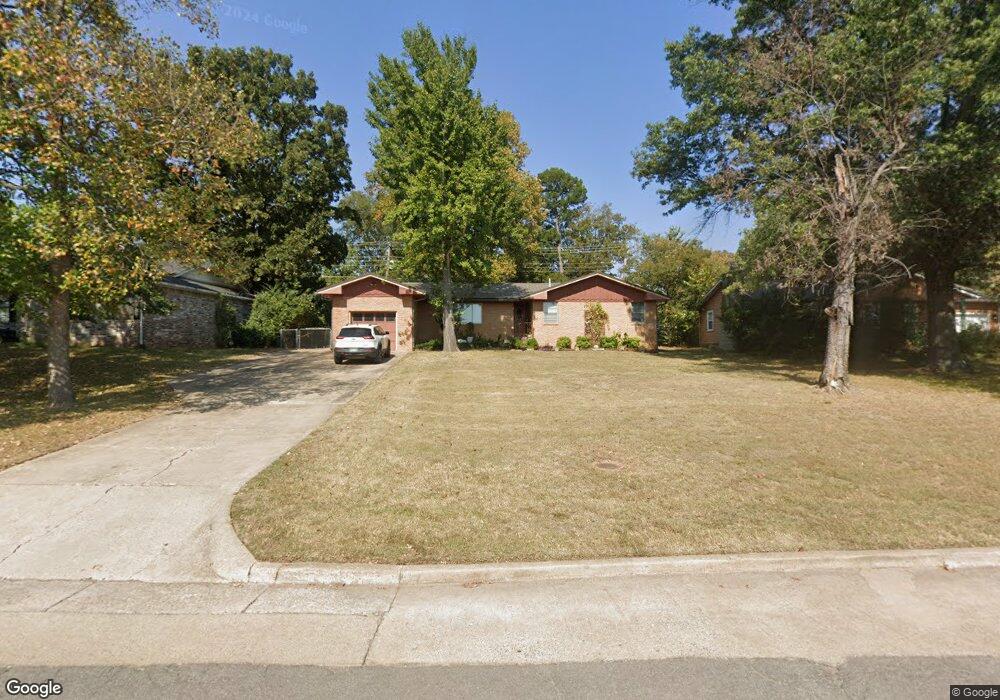
205 E Fuller St Tahlequah, OK 74464
Estimated Value: $126,000 - $170,000
3
Beds
2
Baths
1,390
Sq Ft
$111/Sq Ft
Est. Value
About This Home
This home is located at 205 E Fuller St, Tahlequah, OK 74464 and is currently estimated at $154,618, approximately $111 per square foot. 205 E Fuller St is a home located in Cherokee County with nearby schools including Greenwood Elementary School, Cherokee Elementary School, and Tahlequah Middle School.
Ownership History
Date
Name
Owned For
Owner Type
Purchase Details
Closed on
Mar 3, 2020
Sold by
Geiger Mark A and Combs Nancy L
Bought by
Hancock Kyle and Hancock Callie
Current Estimated Value
Home Financials for this Owner
Home Financials are based on the most recent Mortgage that was taken out on this home.
Original Mortgage
$133,006
Outstanding Balance
$117,812
Interest Rate
3.62%
Mortgage Type
FHA
Estimated Equity
$36,806
Purchase Details
Closed on
Apr 10, 2008
Sold by
Pettus Rozell John L and Pettus Rozell Tlffany J
Bought by
Geiger Mark A and Combs Nancy J
Home Financials for this Owner
Home Financials are based on the most recent Mortgage that was taken out on this home.
Original Mortgage
$101,020
Interest Rate
6.19%
Mortgage Type
New Conventional
Purchase Details
Closed on
Mar 3, 2006
Sold by
Rowe Fran T
Bought by
Pettus Rozell John L and Pettus Rozell Tiffany J
Create a Home Valuation Report for This Property
The Home Valuation Report is an in-depth analysis detailing your home's value as well as a comparison with similar homes in the area
Home Values in the Area
Average Home Value in this Area
Purchase History
| Date | Buyer | Sale Price | Title Company |
|---|---|---|---|
| Hancock Kyle | $101,000 | Tahlequah Abstract & Ttl Co | |
| Geiger Mark A | $99,000 | Tahlequah Abstract Closing S | |
| Pettus Rozell John L | $76,000 | None Available |
Source: Public Records
Mortgage History
| Date | Status | Borrower | Loan Amount |
|---|---|---|---|
| Open | Hancock Kyle | $133,006 | |
| Previous Owner | Geiger Mark A | $101,020 |
Source: Public Records
Tax History Compared to Growth
Tax History
| Year | Tax Paid | Tax Assessment Tax Assessment Total Assessment is a certain percentage of the fair market value that is determined by local assessors to be the total taxable value of land and additions on the property. | Land | Improvement |
|---|---|---|---|---|
| 2025 | $820 | $8,392 | $1,210 | $7,182 |
| 2024 | $820 | $8,657 | $1,210 | $7,447 |
| 2023 | $820 | $11,110 | $1,201 | $9,909 |
| 2022 | $1,031 | $11,110 | $1,201 | $9,909 |
| 2021 | $1,035 | $11,110 | $1,201 | $9,909 |
| 2020 | $1,119 | $11,803 | $1,201 | $10,602 |
| 2019 | $1,057 | $11,252 | $1,201 | $10,051 |
| 2018 | $1,019 | $10,716 | $1,201 | $9,515 |
| 2017 | $1,017 | $10,716 | $1,201 | $9,515 |
| 2016 | $1,023 | $10,716 | $1,201 | $9,515 |
| 2015 | $1,065 | $11,346 | $1,201 | $10,145 |
| 2014 | $1,025 | $10,889 | $1,201 | $9,688 |
Source: Public Records
Map
Nearby Homes
- 215 S Maple Ave
- 403 S Bluff Ave
- 619 E Cherrie St
- 104 Tommye Ln
- 111 N Logan Dr
- 508 Covington Place
- 605 S Oak Ave
- 101 S Harrison Ave
- 103 S Harrison Ave
- 605 E Ward St
- 609 E Ward St
- 200 Remington Place
- 201 Sandy Cir
- 413 Greenwood Dr
- 321 W Shawnee St
- 640 N Oklahoma Ave
- 224 W Chickasaw St
- 720 S East Ave
- 0 S Hwy 82 A Hwy Unit 2532332
- 717 N Oklahoma Ave
- 203 E Fuller St
- 215 E Fuller St
- 204 E Boone St
- 201 E Fuller St
- 209 E Fuller St
- 202 E Boone St
- 300 E Boone St
- 302 E Fuller St
- 304 E Fuller St
- 200 E Boone St
- 300 E Fuller St
- 302 E Boone St
- 306 E Fuller St
- 211 E Fuller St
- 211 E Fuller St
- 104 Wilson Ave
- 308 E Fuller St
- 112 Wilson Ave
- 310 E Boone St
- 104 S Oak Ave