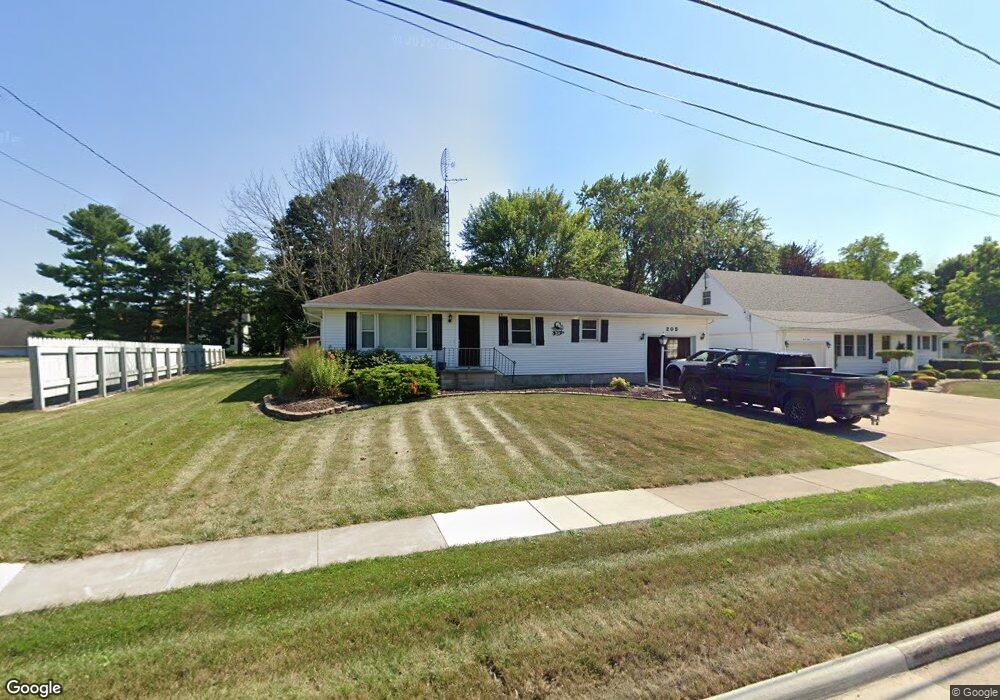
205 E Lutz Rd Archbold, OH 43502
Estimated Value: $165,000 - $225,000
3
Beds
1
Bath
1,148
Sq Ft
$167/Sq Ft
Est. Value
About This Home
This home is located at 205 E Lutz Rd, Archbold, OH 43502 and is currently estimated at $192,283, approximately $167 per square foot. 205 E Lutz Rd is a home located in Fulton County with nearby schools including Archbold Elementary School, Archbold Middle School, and Archbold High School.
Ownership History
Date
Name
Owned For
Owner Type
Purchase Details
Closed on
Nov 20, 2020
Sold by
Curry Benjamin T and Curry Amanda D
Bought by
Shock Brody Ross and Ruger Rylee J
Current Estimated Value
Home Financials for this Owner
Home Financials are based on the most recent Mortgage that was taken out on this home.
Original Mortgage
$157,102
Outstanding Balance
$139,798
Interest Rate
2.8%
Mortgage Type
FHA
Estimated Equity
$52,485
Purchase Details
Closed on
Sep 12, 2009
Sold by
Dominique Sue Ann
Bought by
Curry Benjamin T
Home Financials for this Owner
Home Financials are based on the most recent Mortgage that was taken out on this home.
Original Mortgage
$81,600
Interest Rate
5.32%
Mortgage Type
New Conventional
Purchase Details
Closed on
Jan 1, 1990
Bought by
Dominique Leroy J & Sue Ann Trustees
Create a Home Valuation Report for This Property
The Home Valuation Report is an in-depth analysis detailing your home's value as well as a comparison with similar homes in the area
Home Values in the Area
Average Home Value in this Area
Purchase History
| Date | Buyer | Sale Price | Title Company |
|---|---|---|---|
| Shock Brody Ross | $160,000 | None Available | |
| Curry Benjamin T | $80,000 | Attorney | |
| Dominique Leroy J & Sue Ann Trustees | -- | -- |
Source: Public Records
Mortgage History
| Date | Status | Borrower | Loan Amount |
|---|---|---|---|
| Open | Shock Brody Ross | $157,102 | |
| Previous Owner | Curry Benjamin T | $81,600 |
Source: Public Records
Tax History
| Year | Tax Paid | Tax Assessment Tax Assessment Total Assessment is a certain percentage of the fair market value that is determined by local assessors to be the total taxable value of land and additions on the property. | Land | Improvement |
|---|---|---|---|---|
| 2024 | $2,850 | $54,710 | $8,790 | $45,920 |
| 2023 | $2,877 | $54,710 | $8,790 | $45,920 |
| 2022 | $2,210 | $44,350 | $7,320 | $37,030 |
| 2021 | $2,212 | $44,350 | $7,320 | $37,030 |
| 2020 | $1,775 | $36,440 | $7,320 | $29,120 |
| 2019 | $1,708 | $33,430 | $7,320 | $26,110 |
| 2018 | $1,532 | $33,430 | $7,320 | $26,110 |
| 2017 | $1,488 | $33,430 | $7,320 | $26,110 |
| 2016 | $1,506 | $30,950 | $7,320 | $23,630 |
| 2015 | $1,319 | $30,950 | $7,320 | $23,630 |
| 2014 | $1,319 | $30,950 | $7,320 | $23,630 |
| 2013 | $1,249 | $27,940 | $6,340 | $21,600 |
Source: Public Records
Map
Nearby Homes
- 408 Ditto St
- 307 Murbach St
- 404 Murbach St
- 328 W Lutz Rd Unit 328
- 301 N Pointe Dr
- 219 E Williams St
- 804 Murbach St
- 552 Quail Run
- 808 West St
- 0 Lafayette St
- 112 Sylvanus St
- 224 Hawthorn Dr
- 1808 S Defiance St
- 209 Hawthorn Dr
- 3514 Gaslight Dr
- V-526 Co Rd 25
- 473 Dame St
- 8579 County Road 23
- 18857 US Highway 20a
- 17830 County Road C