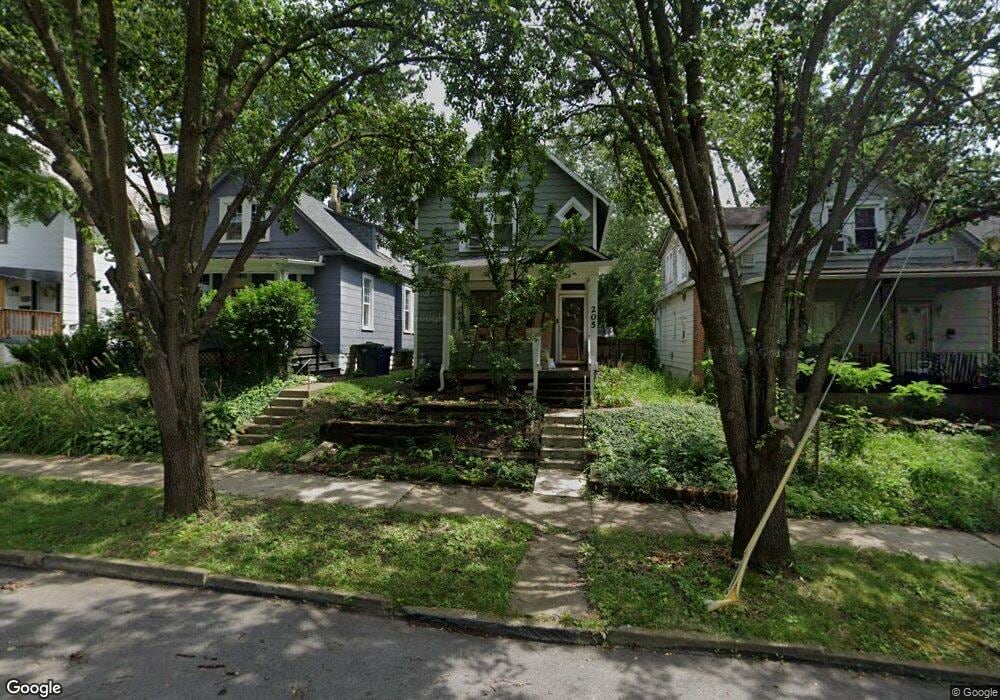
205 E Tompkins St Columbus, OH 43202
Old North Columbus NeighborhoodEstimated Value: $246,000 - $302,797
3
Beds
1
Bath
1,296
Sq Ft
$211/Sq Ft
Est. Value
About This Home
This home is located at 205 E Tompkins St, Columbus, OH 43202 and is currently estimated at $273,699, approximately $211 per square foot. 205 E Tompkins St is a home located in Franklin County with nearby schools including Hubbard Elementary School, Dominion Middle School, and Whetstone High School.
Ownership History
Date
Name
Owned For
Owner Type
Purchase Details
Closed on
Jun 17, 2010
Sold by
Everett Wendy E
Bought by
Everett Wendy E and Ringhiser Chase E
Current Estimated Value
Purchase Details
Closed on
Aug 20, 2001
Sold by
Austin Kacy L
Bought by
Everett Wendy E
Home Financials for this Owner
Home Financials are based on the most recent Mortgage that was taken out on this home.
Original Mortgage
$88,500
Outstanding Balance
$32,843
Interest Rate
7.11%
Mortgage Type
Purchase Money Mortgage
Estimated Equity
$240,856
Purchase Details
Closed on
Jun 20, 1995
Sold by
May Russell
Bought by
Patrick A Mcbride
Home Financials for this Owner
Home Financials are based on the most recent Mortgage that was taken out on this home.
Original Mortgage
$41,500
Interest Rate
8.27%
Mortgage Type
New Conventional
Purchase Details
Closed on
Jun 26, 1990
Purchase Details
Closed on
Apr 15, 1987
Sold by
Mcbride Patrick A and Mcbride Meredith
Bought by
Austin Kacy L
Home Financials for this Owner
Home Financials are based on the most recent Mortgage that was taken out on this home.
Original Mortgage
$51,250
Interest Rate
7.27%
Create a Home Valuation Report for This Property
The Home Valuation Report is an in-depth analysis detailing your home's value as well as a comparison with similar homes in the area
Home Values in the Area
Average Home Value in this Area
Purchase History
| Date | Buyer | Sale Price | Title Company |
|---|---|---|---|
| Everett Wendy E | -- | Independent | |
| Everett Wendy E | $88,500 | -- | |
| Patrick A Mcbride | $44,000 | -- | |
| -- | $28,500 | -- | |
| Austin Kacy L | $64,100 | Northwest Title Worthington |
Source: Public Records
Mortgage History
| Date | Status | Borrower | Loan Amount |
|---|---|---|---|
| Open | Everett Wendy E | $88,500 | |
| Previous Owner | Patrick A Mcbride | $41,500 | |
| Previous Owner | Austin Kacy L | $51,250 |
Source: Public Records
Tax History
| Year | Tax Paid | Tax Assessment Tax Assessment Total Assessment is a certain percentage of the fair market value that is determined by local assessors to be the total taxable value of land and additions on the property. | Land | Improvement |
|---|---|---|---|---|
| 2025 | $4,650 | $103,600 | $28,980 | $74,620 |
| 2024 | $4,650 | $103,600 | $28,980 | $74,620 |
| 2023 | $4,590 | $103,600 | $28,980 | $74,620 |
| 2022 | $2,253 | $43,440 | $13,020 | $30,420 |
| 2021 | $2,257 | $43,440 | $13,020 | $30,420 |
| 2020 | $2,260 | $43,440 | $13,020 | $30,420 |
| 2019 | $2,416 | $39,830 | $10,430 | $29,400 |
| 2018 | $1,974 | $39,830 | $10,430 | $29,400 |
| 2017 | $2,415 | $39,830 | $10,430 | $29,400 |
| 2016 | $1,693 | $25,560 | $6,690 | $18,870 |
| 2015 | $1,537 | $25,560 | $6,690 | $18,870 |
| 2014 | $1,541 | $25,560 | $6,690 | $18,870 |
| 2013 | $1,052 | $35,385 | $6,090 | $29,295 |
Source: Public Records
Map
Nearby Homes
- 2458- 2458 1 2 Deming Ave
- 363 E Hudson St Unit 365
- 2680 Deming Ave
- 109 E Arcadia Ave
- 2395 Summit St Unit 397
- 2362 Indiana Ave
- 6 E Blake Ave
- 415 Glen Echo Cir
- 2540 Neil Ave
- 102 W Tompkins St
- 2295 N 4th St
- 53 Olentangy St
- 2394 Neil Ave
- 2683 Neil Ave Unit 685
- 2836-2838 Indianola Ave Unit 2836
- 9 E Norwich Ave Unit 15
- 2210-2212 N 4th St
- 497 E Oakland Ave
- 580 Crestview Rd
- 2733 Beulah Rd
- 201 E Tompkins St
- 209 E Tompkins St
- 213 E Tompkins St
- 197 E Tompkins St
- 2499 Medary Ave
- 200 Wilcox St
- 193 E Tompkins St
- 200 E Tompkins St
- 219 E Tompkins St
- 189 E Tompkins St
- 192 Clinton St
- 204 Clinton St
- 2479 Medary Ave
- 181 E Tompkins St
- 212 E Tompkins St
- 179 E Tompkins St
- 235 E Tompkins St
- 220 E Tompkins St
- 2515 Medary Ave
- 208 E Tompkins St
Your Personal Tour Guide
Ask me questions while you tour the home.