205 Grant St Turlock, CA 95380
Downtown Turlock NeighborhoodEstimated Value: $380,000 - $417,000
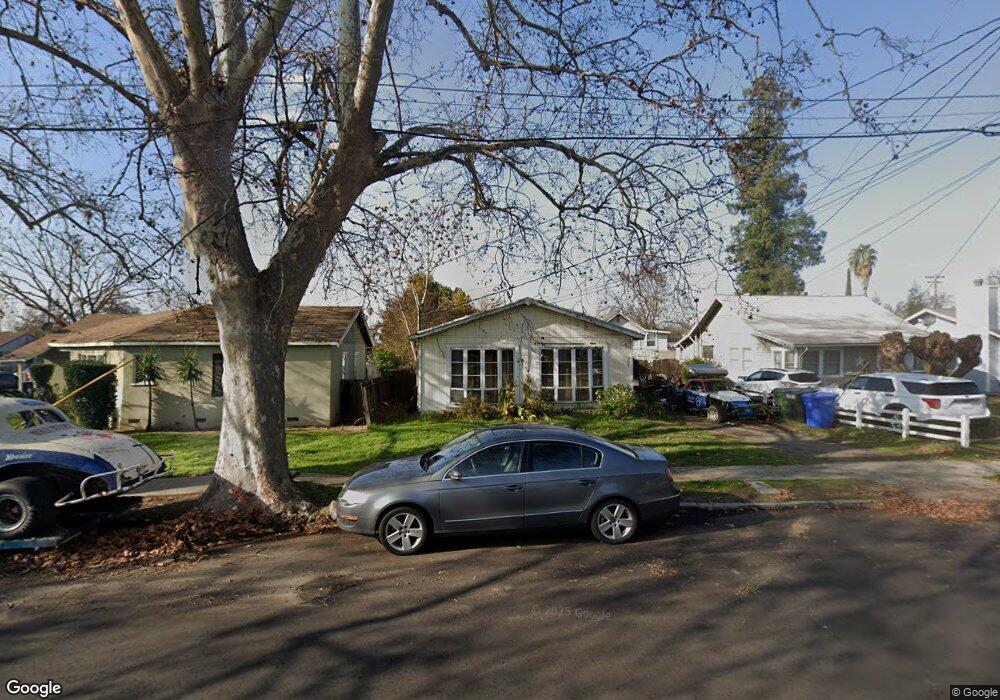
About This Home
This home is located at 205 Grant St, Turlock, CA 95380 and is currently estimated at $392,034, approximately $294 per square foot. 205 Grant St is a home located in Stanislaus County with nearby schools including Wakefield Elementary School, Marvin A. Dutcher Middle School, and Turlock Junior High School.
Ownership History
We collect this data history from publicly available records. To have your information removed, we recommend requesting removal directly through your county’s website.
Purchase Details
Home Financials for this Owner
Home Financials are based on the most recent Mortgage that was taken out on this home.Purchase Details
Home Values in the Area
Average Home Value in this Area
Purchase History
We collect this data history from publicly available records. To have your information removed, we recommend requesting removal directly through your county’s website.
| Date | Buyer | Sale Price | Title Company |
|---|---|---|---|
| $80,000 | Chicago Title Company | ||
| $70,014 | -- |
Mortgage History
We collect this data history from publicly available records. To have your information removed, we recommend requesting removal directly through your county’s website.
| Date | Status | Borrower | Loan Amount |
|---|---|---|---|
| Closed | $81,600 |
Tax History
We collect this data history from publicly available records. To have your information removed, we recommend requesting removal directly through your county’s website.
| Year | Tax Paid | Tax Assessment Tax Assessment Total Assessment is a certain percentage of the fair market value that is determined by local assessors to be the total taxable value of land and additions on the property. | Land | Improvement |
|---|---|---|---|---|
| 2025 | $1,370 | $134,351 | $58,777 | $75,574 |
| 2024 | $1,343 | $131,718 | $57,625 | $74,093 |
| 2023 | $1,339 | $129,137 | $56,496 | $72,641 |
| 2022 | $1,321 | $126,606 | $55,389 | $71,217 |
| 2021 | $1,300 | $124,124 | $54,303 | $69,821 |
| 2020 | $1,290 | $122,853 | $53,747 | $69,106 |
| 2019 | $1,267 | $120,445 | $52,694 | $67,751 |
| 2018 | $1,264 | $118,084 | $51,661 | $66,423 |
| 2017 | $1,233 | $115,770 | $50,649 | $65,121 |
| 2016 | $1,150 | $113,501 | $49,656 | $63,845 |
| 2015 | $1,139 | $111,797 | $48,911 | $62,886 |
| 2014 | $1,126 | $109,608 | $47,953 | $61,655 |
Map
- 350 West Ave N
- 594 Park St
- 350 West Ave S
- 312 W Main St
- 871 Vermont Ave
- 900 W Canal Dr Unit 100
- 556 Vermont Ave
- 300 N Soderquist Rd
- 309 N Center St
- 311 Mitchell Ave
- 612 N Thor St
- 200 N Tully Rd
- 522 Wolfe Ave
- 411 Crane Ave
- 628 Williams Ave
- 421 Allen Way
- 500 N Tully Rd Unit 64
- 500 N Tully Rd Unit 39
- 500 N Tully Rd Unit 64
- 432 S Palm St
- 655 W Olive Ave
- 637 W Olive Ave
- 681 W Olive Ave
- 685 W Olive Ave
- 620 Florence St
- 209 Grant St
- 601 W Olive Ave
- 618 Florence St
- 693 W Olive Ave
- 642 Florence St
- 658 W Olive Ave
- 642 W Olive Ave
- 666 Florence St
- 215 Grant St
- 630 W Olive Ave
- 682 W Olive Ave
- 711 W Olive Ave
- 690 Florence St
- 600 Florence St
- 109 Grant St
Ask me questions while you tour the home.