Estimated Value: $138,243 - $149,000
Studio
1
Bath
1,091
Sq Ft
$133/Sq Ft
Est. Value
About This Home
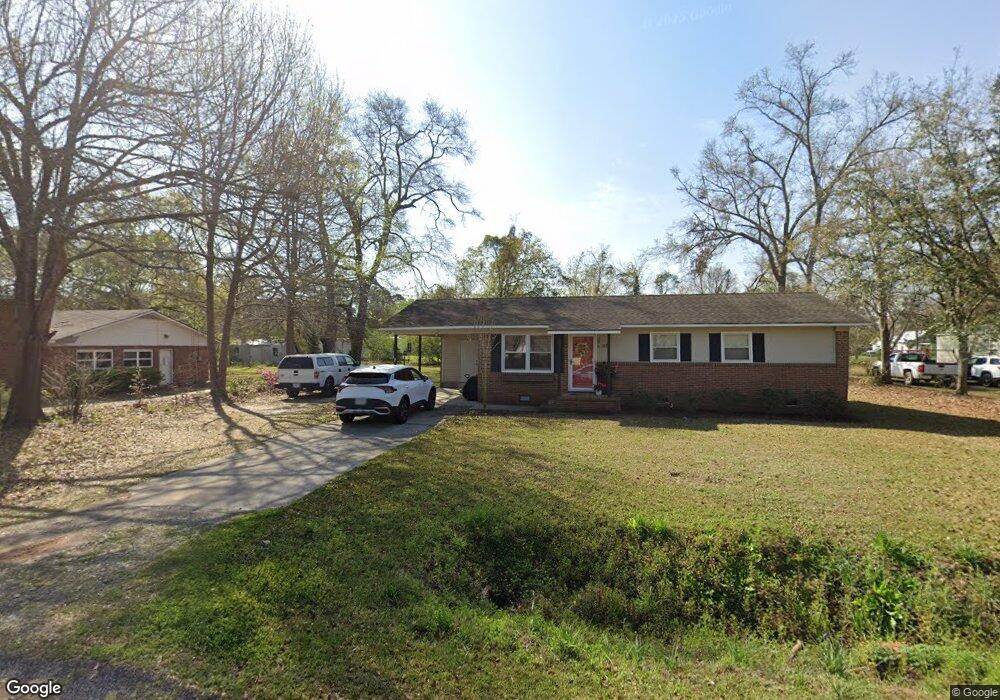
This home is located at 205 Harrell Ave, Lenox, GA 31637 and is currently estimated at $144,561, approximately $132 per square foot. 205 Harrell Ave is a home located in Cook County with nearby schools including Cook Primary School, Cook Elementary School, and Cook County Middle School.
Ownership History
Date
Name
Owned For
Owner Type
Purchase Details
Closed on
Jun 6, 2025
Sold by
Rountree Abby Lynn
Bought by
Chavez Victor Perez and Perez Carmela
Current Estimated Value
Home Financials for this Owner
Home Financials are based on the most recent Mortgage that was taken out on this home.
Original Mortgage
$141,391
Outstanding Balance
$141,270
Interest Rate
6.76%
Mortgage Type
New Conventional
Estimated Equity
$3,292
Purchase Details
Closed on
Jan 17, 2014
Sold by
Sumner Paul W
Bought by
Rountree Abby Lynn and Rountree Kenneth
Home Financials for this Owner
Home Financials are based on the most recent Mortgage that was taken out on this home.
Original Mortgage
$53,059
Interest Rate
4.48%
Mortgage Type
New Conventional
Purchase Details
Closed on
Feb 19, 2007
Sold by
Sumner Paul W
Bought by
Sumner Paul W and Sumner Sandra R
Create a Home Valuation Report for This Property
The Home Valuation Report is an in-depth analysis detailing your home's value as well as a comparison with similar homes in the area
Purchase History
| Date | Buyer | Sale Price | Title Company |
|---|---|---|---|
| Chavez Victor Perez | $144,000 | -- | |
| Rountree Abby Lynn | $52,000 | -- | |
| Sumner Paul W | -- | -- |
Source: Public Records
Mortgage History
| Date | Status | Borrower | Loan Amount |
|---|---|---|---|
| Open | Chavez Victor Perez | $141,391 | |
| Previous Owner | Rountree Abby Lynn | $49,255 | |
| Previous Owner | Rountree Abby Lynn | $53,059 |
Source: Public Records
Tax History
| Year | Tax Paid | Tax Assessment Tax Assessment Total Assessment is a certain percentage of the fair market value that is determined by local assessors to be the total taxable value of land and additions on the property. | Land | Improvement |
|---|---|---|---|---|
| 2025 | $1,053 | $30,194 | $2,834 | $27,360 |
| 2024 | $631 | $23,424 | $2,240 | $21,184 |
| 2023 | $543 | $20,144 | $2,000 | $18,144 |
| 2022 | $543 | $20,144 | $2,000 | $18,144 |
| 2021 | $483 | $16,720 | $2,000 | $14,720 |
| 2020 | $483 | $16,720 | $2,000 | $14,720 |
| 2019 | $483 | $16,720 | $2,000 | $14,720 |
| 2018 | $483 | $16,720 | $2,000 | $14,720 |
| 2017 | $484 | $16,720 | $2,000 | $14,720 |
| 2016 | $484 | $16,720 | $2,000 | $14,720 |
| 2015 | $485 | $16,720 | $2,000 | $14,720 |
| 2014 | $486 | $16,720 | $2,000 | $14,720 |
| 2013 | -- | $16,720 | $2,000 | $14,720 |
Source: Public Records
Map
Nearby Homes
- 326 N Robinson St
- 126 N Broad St
- 320 E Central Ave
- 83 W Gray Ave
- 801 S Broad St
- 15170 U S 41
- 1629 Baker Sawmill Rd
- 0 Barneyville Rd Unit 149717
- 14268 Georgia 125
- 35 Lake Larry Dr
- 0 E 0 Hwy 125 S
- 0 Red Bird Rd
- 0 Omega-Eldorado Rd
- 101 Red Bird Rd
- 69 Branch Ln
- 8422 Massee Post Rd
- 103 N College St
- 284 Barrett Rd
- 0 S Us Hwy 41 Lee Ball Rd Unit 134993
- 134 Brandy Ct
- 104 Harrell Ave
- 280 N Rentz St
- 215 Harrell Ave
- 107 E College Ave
- 85 E College Ave
- 35 Harrell Ave
- 401 N Rentz St
- 283 N Broad St
- 106 E College Ave
- 408 N Broad St
- 261 N Broad St
- 404 N Broad St
- 141 E College Ave
- 11 Harrell Ave
- 54 Mcclelland Ln
- 514 N Broad St
- 161 E College Ave
- 215 E College Ave
- 219 E College Ave
- 369 N Broad St
Your Personal Tour Guide
Ask me questions while you tour the home.