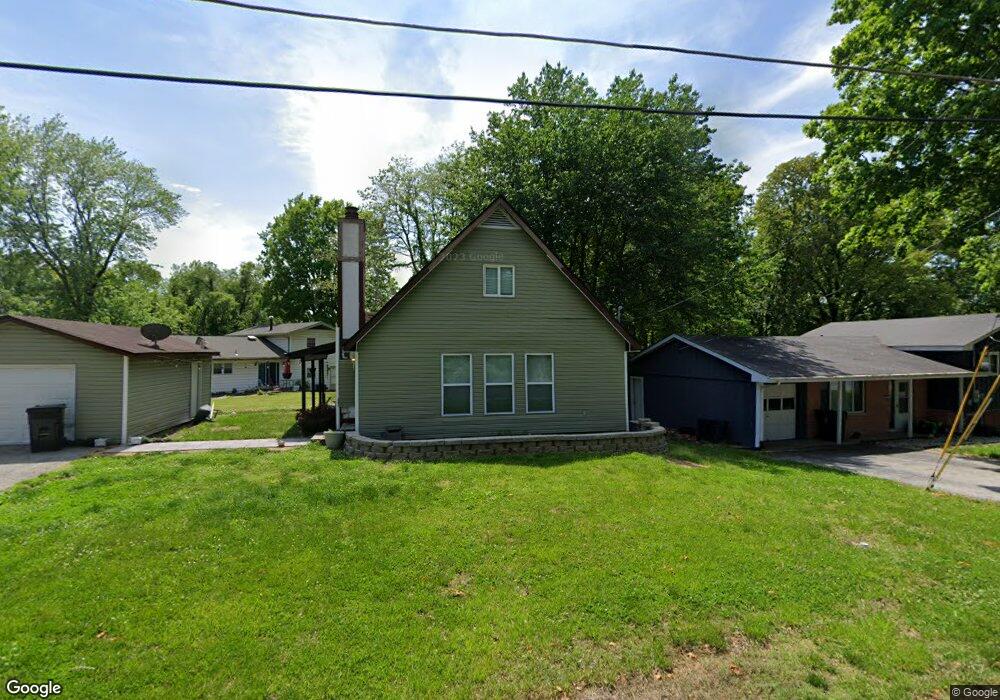
205 Highwood Dr Belleville, IL 62223
Estimated Value: $120,000 - $168,000
3
Beds
2
Baths
1,170
Sq Ft
$121/Sq Ft
Est. Value
About This Home
This home is located at 205 Highwood Dr, Belleville, IL 62223 and is currently estimated at $141,741, approximately $121 per square foot. 205 Highwood Dr is a home located in St. Clair County with nearby schools including Illini Elementary School, Grant Middle School, and Blessed Sacrament Catholic School.
Ownership History
Date
Name
Owned For
Owner Type
Purchase Details
Closed on
Jun 16, 2021
Sold by
Helix Capital Llc
Bought by
Johnson Alex D and Johnson Latanya S
Current Estimated Value
Purchase Details
Closed on
Oct 21, 2019
Sold by
Americole Inc
Bought by
Humphries Bethany and Highwood Drive Investment Trust
Purchase Details
Closed on
Aug 14, 2017
Sold by
Harbour Portfolio Viii Lp
Bought by
Inverse Asset Fund Llc
Purchase Details
Closed on
Apr 9, 2015
Sold by
Harbour Portfolio Viii Lp
Bought by
National Asset Mortgage Llc
Purchase Details
Closed on
Nov 4, 2014
Sold by
Harbour Portfolio Viii Lp
Bought by
Harbour Portfolio Viii Lp
Purchase Details
Closed on
May 12, 2014
Sold by
Leathers Georgena and Leathers Georgena Rosanna
Bought by
Federal National Mortgage Association
Create a Home Valuation Report for This Property
The Home Valuation Report is an in-depth analysis detailing your home's value as well as a comparison with similar homes in the area
Home Values in the Area
Average Home Value in this Area
Purchase History
| Date | Buyer | Sale Price | Title Company |
|---|---|---|---|
| Johnson Alex D | $34,500 | None Available | |
| Humphries Bethany | -- | None Available | |
| Humphries Bethany | -- | None Available | |
| Inverse Asset Fund Llc | $14,000 | Attorney | |
| National Asset Mortgage Llc | -- | None Available | |
| Harbour Portfolio Viii Lp | $12,500 | -- | |
| Federal National Mortgage Association | -- | None Available |
Source: Public Records
Tax History Compared to Growth
Tax History
| Year | Tax Paid | Tax Assessment Tax Assessment Total Assessment is a certain percentage of the fair market value that is determined by local assessors to be the total taxable value of land and additions on the property. | Land | Improvement |
|---|---|---|---|---|
| 2024 | $3,297 | $40,310 | $2,266 | $38,044 |
| 2023 | $2,831 | $33,637 | $2,220 | $31,417 |
| 2022 | $3,166 | $30,282 | $1,999 | $28,283 |
| 2021 | $2,988 | $27,995 | $1,848 | $26,147 |
| 2020 | $2,887 | $26,474 | $1,748 | $24,726 |
| 2019 | $2,747 | $25,050 | $1,751 | $23,299 |
| 2018 | $2,659 | $24,508 | $1,713 | $22,795 |
| 2017 | $2,672 | $24,336 | $1,701 | $22,635 |
| 2016 | $2,635 | $23,819 | $1,665 | $22,154 |
| 2014 | $2,034 | $27,014 | $1,674 | $25,340 |
| 2013 | $2,139 | $27,400 | $1,698 | $25,702 |
Source: Public Records
Map
Nearby Homes
- 1 AC Highridge Dr
- 9629 Holdener Place
- 0 Holdener Dr
- 11 Greenwood Ct
- 20 Hilldale Dr
- 1314 Dutch Hollow Rd
- 38 Smalling Ct
- 10 Hill Dr Unit . A, B, C
- 10 Hill Dr Unit D, E, F
- 104 Pyramid Dr
- 45 Nottingham Ln Unit 2
- 0 Nottingham Ln Unit MAR24076812
- 134 N 82nd St
- 27 Carr Park Rd
- 118 Pamela Dr
- 80 N 98th St
- 9723 Greenridge Heights Rd
- 102 N 81st St
- 212 Woodcrest Dr
- 6 N 95th St
- 209 Highwood Dr
- 5 Highwood Place
- 9 Highwood Place
- 213 Highwood Dr
- 22 Highwood Rd
- 25 Highwood Rd
- 212 Highwood Dr
- 212 Highwood Dr
- 13 Highwood Place
- 25 Highwood Dr
- 2 Highwood Place
- 217 Highwood Dr
- 136 Highwood Dr
- 1 Highwood Ln
- 221 Highwood Dr
- 132 Highwood Dr
- 15 Highwood Place
- 55 Highwood Rd
- 14 Highwood Place
- 8 Highwood Ln