Estimated Value: $252,869 - $308,000
4
Beds
3
Baths
2,288
Sq Ft
$122/Sq Ft
Est. Value
About This Home
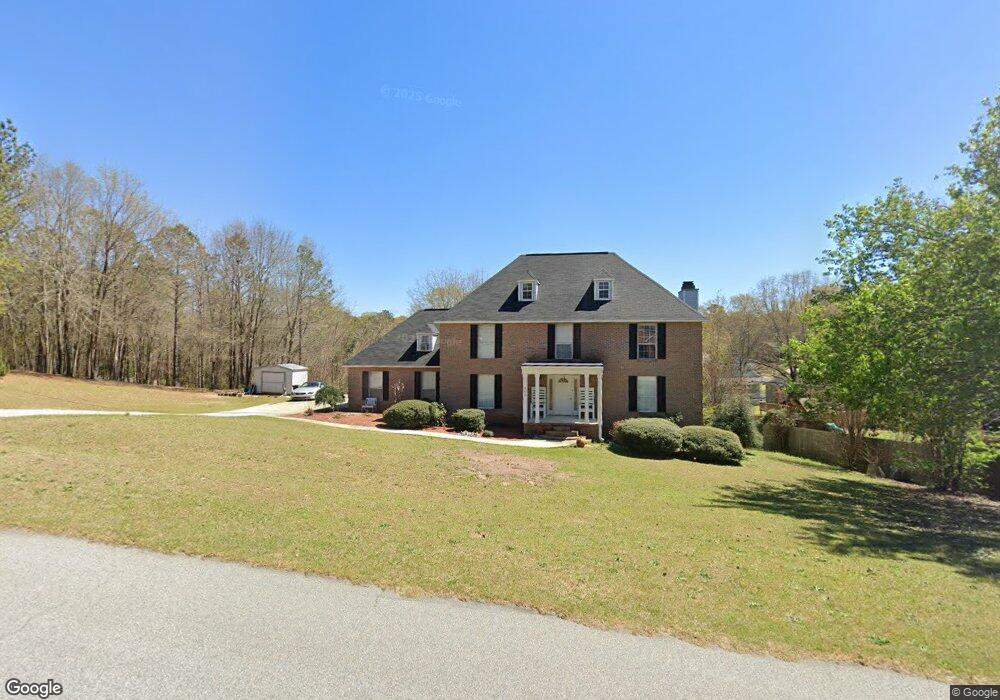
This home is located at 205 Hunters Chase, Byron, GA 31008 and is currently estimated at $279,717, approximately $122 per square foot. 205 Hunters Chase is a home located in Peach County with nearby schools including Byron Elementary School, Byron Middle School, and Peach County High School.
Ownership History
Date
Name
Owned For
Owner Type
Purchase Details
Closed on
Oct 16, 2020
Sold by
Briscoe Kathleen
Bought by
Washington Charles
Current Estimated Value
Purchase Details
Closed on
Feb 27, 2006
Sold by
Washington Charles Jr
Bought by
Washington Charles Jr and Washington Carmen Y
Home Financials for this Owner
Home Financials are based on the most recent Mortgage that was taken out on this home.
Original Mortgage
$128,800
Interest Rate
6.05%
Mortgage Type
New Conventional
Purchase Details
Closed on
Oct 29, 2003
Sold by
Concepcion William V and Concepcion Maria
Bought by
Woodard Chad E
Purchase Details
Closed on
Jul 13, 1999
Sold by
Blando Shirley
Bought by
Concepcion William V and Concepcion Maria A
Create a Home Valuation Report for This Property
The Home Valuation Report is an in-depth analysis detailing your home's value as well as a comparison with similar homes in the area
Home Values in the Area
Average Home Value in this Area
Purchase History
| Date | Buyer | Sale Price | Title Company |
|---|---|---|---|
| Washington Charles | $22,500 | -- | |
| Washington Charles Jr | -- | -- | |
| Washington Charles Jr | $161,000 | -- | |
| Woodard Chad E | $152,000 | -- | |
| Concepcion William V | $124,000 | -- |
Source: Public Records
Mortgage History
| Date | Status | Borrower | Loan Amount |
|---|---|---|---|
| Previous Owner | Washington Charles Jr | $128,800 | |
| Previous Owner | Washington Charles Jr | $30,200 |
Source: Public Records
Tax History
| Year | Tax Paid | Tax Assessment Tax Assessment Total Assessment is a certain percentage of the fair market value that is determined by local assessors to be the total taxable value of land and additions on the property. | Land | Improvement |
|---|---|---|---|---|
| 2025 | $3,469 | $99,440 | $9,120 | $90,320 |
| 2024 | $3,193 | $89,480 | $9,000 | $80,480 |
| 2023 | $3,201 | $89,120 | $7,200 | $81,920 |
| 2022 | $2,128 | $79,040 | $7,200 | $71,840 |
| 2021 | $2,093 | $67,040 | $7,200 | $59,840 |
| 2020 | $2,071 | $66,320 | $7,200 | $59,120 |
| 2019 | $1,967 | $62,680 | $7,200 | $55,480 |
| 2018 | $1,977 | $62,680 | $7,200 | $55,480 |
| 2017 | $1,986 | $62,680 | $7,200 | $55,480 |
| 2016 | $1,978 | $62,680 | $7,200 | $55,480 |
| 2015 | $1,981 | $62,680 | $7,200 | $55,480 |
| 2014 | $1,984 | $62,680 | $7,200 | $55,480 |
| 2013 | -- | $62,680 | $7,200 | $55,480 |
Source: Public Records
Map
Nearby Homes
- 103 Fawn Ct
- 110 Pine Crest Dr
- 101 Poppy Ln
- 506 Howard St
- 102 Silver Maple Ct
- 105 Pine Hill Cir
- 204 Sugar Maple Ct
- 107 Pine Hill Cir
- 107 Silver Maple Ct
- 109 Silver Maple Ct
- 416 Moseley Rd
- 00 Rum Rd
- 0 Moseley Rd Unit 10582548
- 0 Moseley Rd Unit 255314
- 0 Moseley Rd Unit 180905
- 109 Dempsey St
- 0 Rum Rd Unit 10673128
- 00 Georgia 49
- 104 Robinson St
- 103 Bellamy Way
- 0 Hunter's Chase
- 110 Buckskin Trail
- 124 Buckskin Trail
- 207 Hunters Chase
- LOT 22 Buckskin Trail
- 0 Buckskin Trail Unit 3240899
- 0 Buckskin Trail Unit 3240898
- 0 Buckskin Trail Unit 223389
- 0 Buckskin Trail Unit 10055777
- 206 Hunters Chase
- 116 Buckskin Trail
- 204 Hunters Chase
- 208 Hunters Chase
- 120 Buckskin Trail
- 202 Hunters Chase
- 210 Hunters Chase
- 113 Buckskin Trail
- 111 Buckskin Trail
- 212 Hunters Chase
- 109 Buckskin Trail
Your Personal Tour Guide
Ask me questions while you tour the home.