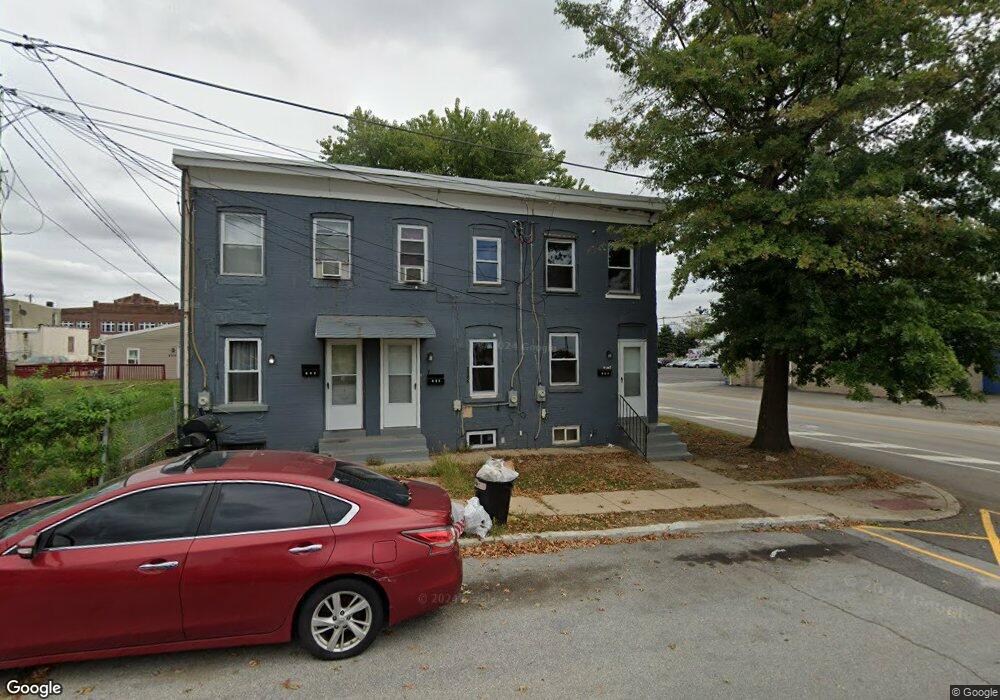
205 Irving St Marcus Hook, PA 19061
Estimated Value: $109,000 - $265,062
3
Beds
1
Bath
1,008
Sq Ft
$165/Sq Ft
Est. Value
About This Home
This home is located at 205 Irving St, Marcus Hook, PA 19061 and is currently estimated at $166,016, approximately $164 per square foot. 205 Irving St is a home located in Delaware County with nearby schools including Chichester Senior High School, Chester Charter School for the Arts, and Frederick Douglass Christian School.
Ownership History
Date
Name
Owned For
Owner Type
Purchase Details
Closed on
Feb 22, 2023
Sold by
Btcg Llc
Bought by
Ridham Estates Llc
Current Estimated Value
Home Financials for this Owner
Home Financials are based on the most recent Mortgage that was taken out on this home.
Original Mortgage
$95,000
Outstanding Balance
$91,910
Interest Rate
6.13%
Mortgage Type
New Conventional
Estimated Equity
$74,106
Purchase Details
Closed on
Jan 24, 2022
Sold by
Nickson Dominica M
Bought by
Nickson Dominica M and Nickson Raymond
Purchase Details
Closed on
Feb 7, 2020
Sold by
Barlow Skyla
Bought by
Marusco Dominic
Purchase Details
Closed on
May 29, 2001
Sold by
Poulicci James
Bought by
Barlow Sklya
Create a Home Valuation Report for This Property
The Home Valuation Report is an in-depth analysis detailing your home's value as well as a comparison with similar homes in the area
Home Values in the Area
Average Home Value in this Area
Purchase History
| Date | Buyer | Sale Price | Title Company |
|---|---|---|---|
| Ridham Estates Llc | $89,000 | -- | |
| Nickson Dominica M | -- | None Listed On Document | |
| Marusco Dominic | $7,000 | Isave Abstract Llc | |
| Barlow Sklya | $4,500 | -- |
Source: Public Records
Mortgage History
| Date | Status | Borrower | Loan Amount |
|---|---|---|---|
| Open | Ridham Estates Llc | $95,000 |
Source: Public Records
Tax History
| Year | Tax Paid | Tax Assessment Tax Assessment Total Assessment is a certain percentage of the fair market value that is determined by local assessors to be the total taxable value of land and additions on the property. | Land | Improvement |
|---|---|---|---|---|
| 2025 | $2,306 | $58,630 | $17,780 | $40,850 |
| 2024 | $2,306 | $58,630 | $17,780 | $40,850 |
| 2023 | $2,244 | $58,630 | $17,780 | $40,850 |
| 2022 | $2,198 | $58,630 | $17,780 | $40,850 |
| 2021 | $3,102 | $58,630 | $17,780 | $40,850 |
| 2020 | $1,463 | $24,360 | $16,720 | $7,640 |
| 2019 | $1,463 | $24,360 | $16,720 | $7,640 |
| 2018 | $1,467 | $24,360 | $0 | $0 |
| 2017 | $1,457 | $24,360 | $0 | $0 |
| 2016 | $136 | $24,360 | $0 | $0 |
| 2015 | $136 | $24,360 | $0 | $0 |
| 2014 | $134 | $24,360 | $0 | $0 |
Source: Public Records
Map
Nearby Homes
- 3320 W 3rd St
- 3 Union St
- 3038 W 2nd St
- 0 Price St
- 2821 W 3rd St
- 3000 W 6th St
- 3011 W 7th St
- 426 Highland Ave
- 321 Highland Ave
- 411 Highland Ave
- 1107 Meadow Ln
- 1001 Sunset St
- 1114 Clover Ln
- 914 Anderson Ave
- 0 9th & Chestnut Unit PADE2105654
- 907 913 Meadow Ln
- 917 923 Meadow Ln
- 4211 W 5th St
- 5 Property Portfolio
- 918 Highland Ave
Your Personal Tour Guide
Ask me questions while you tour the home.