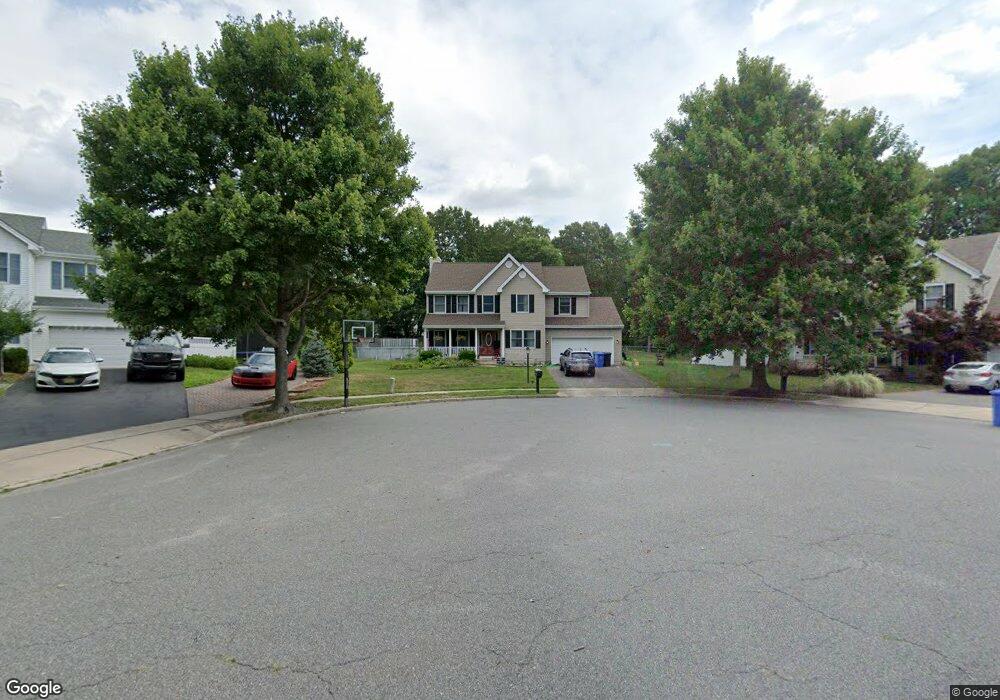
205 Lazy Oak Ln Manahawkin, NJ 08050
Stafford NeighborhoodEstimated Value: $537,604 - $621,000
4
Beds
3
Baths
2,134
Sq Ft
$277/Sq Ft
Est. Value
About This Home
This home is located at 205 Lazy Oak Ln, Manahawkin, NJ 08050 and is currently estimated at $591,901, approximately $277 per square foot. 205 Lazy Oak Ln is a home located in Ocean County with nearby schools including Ocean Acres Elementary School, Oxycocus Elementary School, and McKinley Avenue Elementary School.
Ownership History
Date
Name
Owned For
Owner Type
Purchase Details
Closed on
Apr 29, 2019
Sold by
Wyrsch David L and Wyrsch Christina
Bought by
Wyrsch Christina
Current Estimated Value
Home Financials for this Owner
Home Financials are based on the most recent Mortgage that was taken out on this home.
Original Mortgage
$225,000
Outstanding Balance
$197,821
Interest Rate
4.2%
Mortgage Type
New Conventional
Estimated Equity
$394,080
Purchase Details
Closed on
Jun 28, 2001
Sold by
Oliveira John
Bought by
Wyrsch David and Wyrsch Christina
Home Financials for this Owner
Home Financials are based on the most recent Mortgage that was taken out on this home.
Original Mortgage
$189,900
Interest Rate
7.14%
Purchase Details
Closed on
Feb 16, 1996
Sold by
Walters & Sons Const
Bought by
Oliveira John and Oliveira Deneen
Home Financials for this Owner
Home Financials are based on the most recent Mortgage that was taken out on this home.
Original Mortgage
$115,000
Interest Rate
7.67%
Create a Home Valuation Report for This Property
The Home Valuation Report is an in-depth analysis detailing your home's value as well as a comparison with similar homes in the area
Home Values in the Area
Average Home Value in this Area
Purchase History
| Date | Buyer | Sale Price | Title Company |
|---|---|---|---|
| Wyrsch Christina | -- | Landguard Title Services Llc | |
| Wyrsch David | $211,000 | -- | |
| Oliveira John | $153,395 | -- |
Source: Public Records
Mortgage History
| Date | Status | Borrower | Loan Amount |
|---|---|---|---|
| Open | Wyrsch Christina | $225,000 | |
| Closed | Wyrsch David | $189,900 | |
| Previous Owner | Oliveira John | $115,000 |
Source: Public Records
Tax History Compared to Growth
Tax History
| Year | Tax Paid | Tax Assessment Tax Assessment Total Assessment is a certain percentage of the fair market value that is determined by local assessors to be the total taxable value of land and additions on the property. | Land | Improvement |
|---|---|---|---|---|
| 2025 | $6,424 | $258,700 | $64,300 | $194,400 |
| 2024 | $6,361 | $258,700 | $64,300 | $194,400 |
| 2023 | $6,090 | $258,700 | $64,300 | $194,400 |
| 2022 | $6,090 | $258,700 | $64,300 | $194,400 |
| 2021 | $6,007 | $258,700 | $64,300 | $194,400 |
| 2020 | $6,015 | $258,700 | $64,300 | $194,400 |
| 2019 | $5,929 | $258,700 | $64,300 | $194,400 |
| 2018 | $5,893 | $258,700 | $64,300 | $194,400 |
| 2017 | $6,003 | $255,100 | $66,100 | $189,000 |
| 2016 | $5,941 | $255,100 | $66,100 | $189,000 |
| 2015 | $5,732 | $255,100 | $66,100 | $189,000 |
| 2014 | $5,658 | $248,700 | $66,100 | $182,600 |
Source: Public Records
Map
Nearby Homes
- 117 Autumn Oak Ln
- 189 Lighthouse Dr
- 140 Riptide Ave
- 937 Sandy Cir
- 120 Riptide Ave
- 1015 Barnacle Dr
- 1079 Helm Ave
- 135 Nautilus Dr
- 109 Hollow Oak Ln
- 159 Bluejacket Ave
- 252 Nautilus Dr
- 248 Matey Ave
- 1073 Cutlass Ave
- 1174 Steamer Ave
- 55 Holloway Ave
- 163 Bradshaw Dr
- 1195 Windlass Dr
- 296 Nautilus Dr
- 1215 Canal Ave
- 1018 Vessel Ln
- 322 Winding Oak Trail
- 209 Lazy Oak Ln
- 326 Winding Oak Trail
- 330 Winding Oak Trail
- 318 Winding Oak Trail
- 213 Lazy Oak Ln
- 202 Lazy Oak Ln
- 206 Lazy Oak Ln
- 210 Lazy Oak Ln
- 334 Winding Oak Trail
- 314 Winding Oak Trail
- 323 Winding Oak Trail
- 214 Lazy Oak Ln
- 333 Winding Oak Trail
- 101 Autumn Oak Ln
- 105 Autumn Oak Ln
- 310 Winding Oak Trail
- 218 Lazy Oak Ln
- 109 Autumn Oak Ln
- 313 Winding Oak Trail