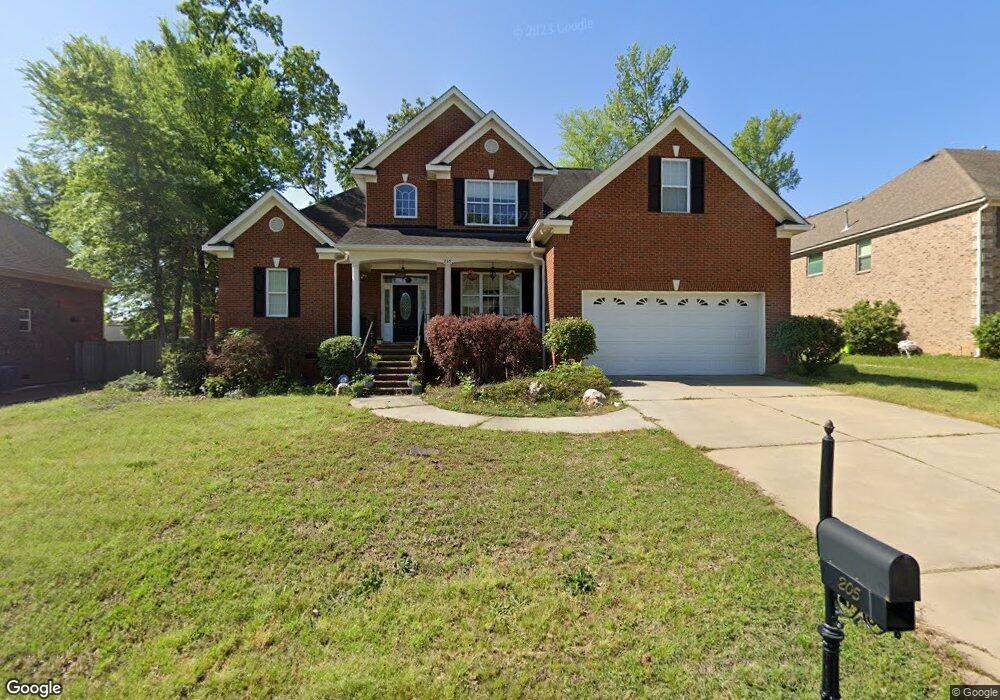
205 Massey Cir Chapin, SC 29036
Estimated Value: $425,000 - $571,000
4
Beds
3
Baths
3,070
Sq Ft
$154/Sq Ft
Est. Value
About This Home
This home is located at 205 Massey Cir, Chapin, SC 29036 and is currently estimated at $471,460, approximately $153 per square foot. 205 Massey Cir is a home located in Richland County with nearby schools including Ballentine Elementary School, Chapin Intermediate, and Chapin High School.
Ownership History
Date
Name
Owned For
Owner Type
Purchase Details
Closed on
Jun 23, 2021
Sold by
Collins Andrew Vincent and Collins Cristel Greene
Bought by
Hanz Keith M
Current Estimated Value
Home Financials for this Owner
Home Financials are based on the most recent Mortgage that was taken out on this home.
Original Mortgage
$331,520
Outstanding Balance
$300,150
Interest Rate
2.9%
Mortgage Type
VA
Estimated Equity
$171,310
Purchase Details
Closed on
May 28, 2020
Sold by
Collins Cristel G and Collins Anderw V
Bought by
Collins Anderw Vincent and Collins Cristel Greene
Purchase Details
Closed on
Aug 14, 2012
Sold by
M & E Custom Homes Llc
Bought by
Collins Andrew V
Home Financials for this Owner
Home Financials are based on the most recent Mortgage that was taken out on this home.
Original Mortgage
$266,750
Interest Rate
3.65%
Mortgage Type
New Conventional
Create a Home Valuation Report for This Property
The Home Valuation Report is an in-depth analysis detailing your home's value as well as a comparison with similar homes in the area
Home Values in the Area
Average Home Value in this Area
Purchase History
| Date | Buyer | Sale Price | Title Company |
|---|---|---|---|
| Hanz Keith M | $320,000 | None Available | |
| Collins Anderw Vincent | -- | None Available | |
| Collins Andrew V | $275,261 | None Available |
Source: Public Records
Mortgage History
| Date | Status | Borrower | Loan Amount |
|---|---|---|---|
| Open | Hanz Keith M | $331,520 | |
| Previous Owner | Collins Andrew V | $266,750 |
Source: Public Records
Tax History Compared to Growth
Tax History
| Year | Tax Paid | Tax Assessment Tax Assessment Total Assessment is a certain percentage of the fair market value that is determined by local assessors to be the total taxable value of land and additions on the property. | Land | Improvement |
|---|---|---|---|---|
| 2024 | $2,885 | $346,700 | $50,000 | $296,700 |
| 2023 | $2,773 | $12,800 | $0 | $0 |
| 2022 | $2,526 | $320,000 | $48,000 | $272,000 |
| 2021 | $1,946 | $9,280 | $0 | $0 |
| 2020 | $2,036 | $9,280 | $0 | $0 |
| 2019 | $2,021 | $9,280 | $0 | $0 |
| 2018 | $1,739 | $8,960 | $0 | $0 |
| 2017 | $1,694 | $8,960 | $0 | $0 |
| 2016 | $1,686 | $8,960 | $0 | $0 |
| 2015 | $1,694 | $8,960 | $0 | $0 |
| 2014 | $2,020 | $275,300 | $0 | $0 |
| 2013 | -- | $11,010 | $0 | $0 |
Source: Public Records
Map
Nearby Homes
- 549 Everton Dr
- 420 Crawley Ln
- 445 Crawley Ln
- 649 Clover View Rd
- 320 Hollow Cove Rd
- 636 Clover View Rd
- 947 Stradley Ln
- 668 Autumn Ridge Rd
- 816 Burnview Ln
- 297 Massey Cir
- 454 Hollow Cove Rd
- 756 Kimsey Dr
- 205 Whitewater Dr
- 11437 Broad River
- 203 Savannah Branch Trail
- 437 Whitewater Dr
- 50 Steve Free Rd
- 520 Whitewater Dr
- 133 Monroe Preserve Ln
- 114 Monroe Preserve Ln