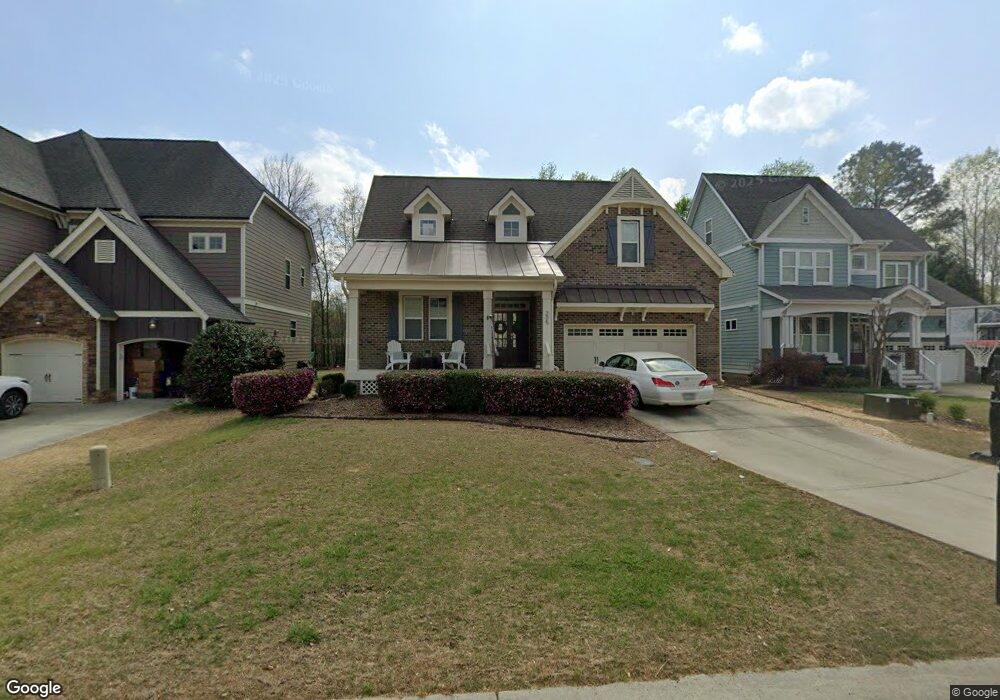
205 Middlegreen Place Holly Springs, NC 27540
Estimated Value: $749,547 - $810,000
4
Beds
5
Baths
3,097
Sq Ft
$251/Sq Ft
Est. Value
About This Home
This home is located at 205 Middlegreen Place, Holly Springs, NC 27540 and is currently estimated at $777,137, approximately $250 per square foot. 205 Middlegreen Place is a home located in Wake County with nearby schools including Middle Creek Elementary School, Holly Ridge Middle School, and Middle Creek High.
Ownership History
Date
Name
Owned For
Owner Type
Purchase Details
Closed on
May 28, 2015
Sold by
Orr William and Orr Debra Sigmon
Bought by
Cape Jonathan Thomas and Cape Casey Lea
Current Estimated Value
Home Financials for this Owner
Home Financials are based on the most recent Mortgage that was taken out on this home.
Original Mortgage
$349,650
Outstanding Balance
$271,199
Interest Rate
3.79%
Mortgage Type
New Conventional
Estimated Equity
$505,938
Purchase Details
Closed on
Mar 21, 2013
Sold by
Garman Homes Llc
Bought by
Orr Debra Sigmon and Orr William
Home Financials for this Owner
Home Financials are based on the most recent Mortgage that was taken out on this home.
Original Mortgage
$297,500
Interest Rate
3.56%
Mortgage Type
New Conventional
Purchase Details
Closed on
Jun 18, 2012
Sold by
Sso Llc
Bought by
Garman Homes Llc
Home Financials for this Owner
Home Financials are based on the most recent Mortgage that was taken out on this home.
Original Mortgage
$240,000
Interest Rate
3.83%
Mortgage Type
Construction
Create a Home Valuation Report for This Property
The Home Valuation Report is an in-depth analysis detailing your home's value as well as a comparison with similar homes in the area
Home Values in the Area
Average Home Value in this Area
Purchase History
| Date | Buyer | Sale Price | Title Company |
|---|---|---|---|
| Cape Jonathan Thomas | $388,500 | None Available | |
| Orr Debra Sigmon | $350,000 | None Available | |
| Garman Homes Llc | $47,000 | None Available |
Source: Public Records
Mortgage History
| Date | Status | Borrower | Loan Amount |
|---|---|---|---|
| Open | Cape Jonathan Thomas | $349,650 | |
| Previous Owner | Orr Debra Sigmon | $297,500 | |
| Previous Owner | Garman Homes Llc | $240,000 |
Source: Public Records
Tax History Compared to Growth
Tax History
| Year | Tax Paid | Tax Assessment Tax Assessment Total Assessment is a certain percentage of the fair market value that is determined by local assessors to be the total taxable value of land and additions on the property. | Land | Improvement |
|---|---|---|---|---|
| 2025 | $6,405 | $741,960 | $120,000 | $621,960 |
| 2024 | $6,379 | $741,960 | $120,000 | $621,960 |
| 2023 | $4,869 | $449,570 | $60,000 | $389,570 |
| 2022 | $4,700 | $449,570 | $60,000 | $389,570 |
| 2021 | $4,613 | $449,570 | $60,000 | $389,570 |
| 2020 | $4,613 | $449,570 | $60,000 | $389,570 |
| 2019 | $4,803 | $397,501 | $60,000 | $337,501 |
| 2018 | $4,340 | $397,501 | $60,000 | $337,501 |
| 2017 | $4,184 | $397,501 | $60,000 | $337,501 |
| 2016 | $4,126 | $397,501 | $60,000 | $337,501 |
| 2015 | $4,157 | $394,210 | $58,000 | $336,210 |
| 2014 | -- | $394,210 | $58,000 | $336,210 |
Source: Public Records
Map
Nearby Homes
- 129 Middlegreen Place
- 108 Eden Glen Dr
- 212 Chieftain Dr
- 436 Edgepine Dr
- 101 Eden Glen Dr
- 4805 Leithcroft Place
- 104 Amberglen Ln
- 121 Amberglen Ln
- 112 Skygrove Dr
- 204 Edgepine Dr
- 608 Skygrove Dr
- 221 Grantwood Dr
- 501 Wescott Ridge Dr
- 120 Breyla Way
- 228 Grantwood Dr
- 308 Wescott Ridge Dr
- 0 Optimist Farm Rd Unit 10126506
- 109 Skywater Ln
- 213 Cross Oaks Place
- 5317 Moonflower Ct
- 209 Middlegreen Place
- 201 Middlegreen Place
- 137 Middlegreen Place
- 213 Middlegreen Place
- 604 Redhill Rd
- 600 Redhill Rd
- 212 Middlegreen Place
- 125 Middlegreen Place
- 101 Middlegreen Place
- 508 Redhill Rd
- 121 Middlegreen Place
- 117 Middlegreen Place
- 105 Middlegreen Place
- 113 Middlegreen Place
- 109 Middlegreen Place
- 504 Redhill Rd
- 501 Redhill Rd
- 528 Wanderview Ln
- 524 Wanderview Ln
- 421 Redhill Rd