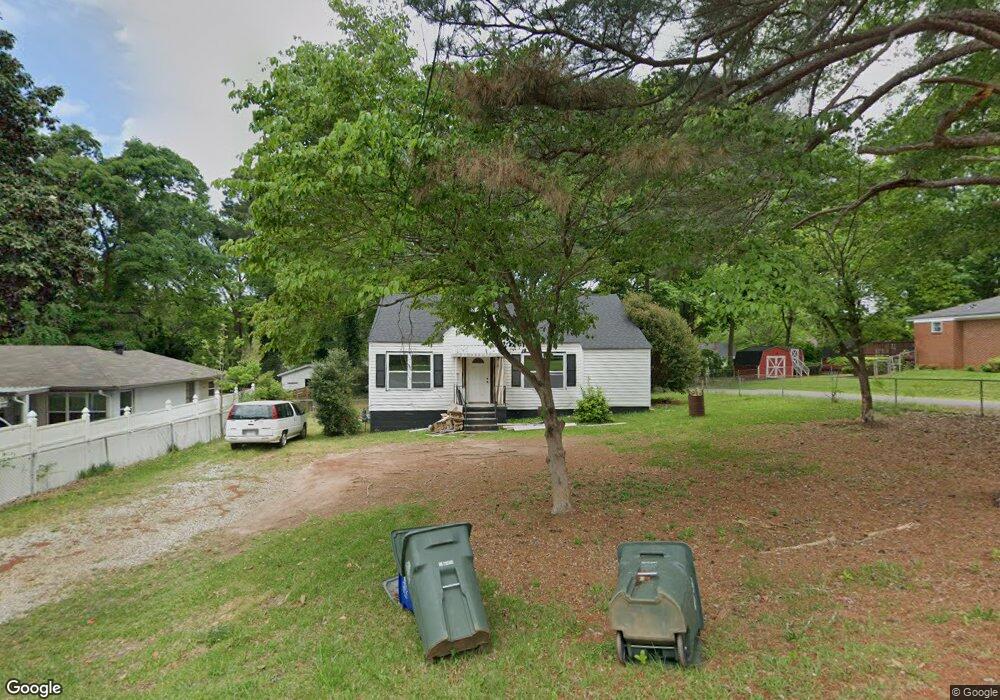
205 Mobley St Griffin, GA 30223
Spalding County NeighborhoodEstimated Value: $121,000 - $161,000
2
Beds
1
Bath
1,043
Sq Ft
$138/Sq Ft
Est. Value
About This Home
This home is located at 205 Mobley St, Griffin, GA 30223 and is currently estimated at $144,235, approximately $138 per square foot. 205 Mobley St is a home located in Spalding County with nearby schools including Orrs Elementary School, Carver Road Middle School, and Griffin High School.
Ownership History
Date
Name
Owned For
Owner Type
Purchase Details
Closed on
May 28, 2021
Sold by
Boynton Jimmie Lee
Bought by
Bivens Adam
Current Estimated Value
Home Financials for this Owner
Home Financials are based on the most recent Mortgage that was taken out on this home.
Original Mortgage
$33,180
Interest Rate
2.9%
Mortgage Type
New Conventional
Purchase Details
Closed on
Aug 15, 1982
Sold by
Parker Terry H and Parker Ann H
Bought by
Luu Sanh and Dough Mai
Purchase Details
Closed on
Oct 22, 1974
Sold by
Newton John T
Bought by
Parker Terry H and Parker Ann H
Purchase Details
Closed on
Aug 9, 1974
Sold by
Murray George N
Bought by
Newton John T
Purchase Details
Closed on
Aug 6, 1974
Sold by
Blackwell Marion J and Annie Grace
Bought by
Murray George N
Purchase Details
Closed on
May 28, 1960
Bought by
Blackwell Marion J and Annie Grace
Create a Home Valuation Report for This Property
The Home Valuation Report is an in-depth analysis detailing your home's value as well as a comparison with similar homes in the area
Home Values in the Area
Average Home Value in this Area
Purchase History
| Date | Buyer | Sale Price | Title Company |
|---|---|---|---|
| Bivens Adam | $37,500 | -- | |
| Luu Sanh | $14,500 | -- | |
| Parker Terry H | $21,500 | -- | |
| Newton John T | -- | -- | |
| Murray George N | -- | -- | |
| Blackwell Marion J | -- | -- |
Source: Public Records
Mortgage History
| Date | Status | Borrower | Loan Amount |
|---|---|---|---|
| Closed | Bivens Adam | $33,180 |
Source: Public Records
Tax History Compared to Growth
Tax History
| Year | Tax Paid | Tax Assessment Tax Assessment Total Assessment is a certain percentage of the fair market value that is determined by local assessors to be the total taxable value of land and additions on the property. | Land | Improvement |
|---|---|---|---|---|
| 2024 | $1,604 | $41,994 | $7,400 | $34,594 |
| 2023 | $1,604 | $23,715 | $6,000 | $17,715 |
| 2022 | $599 | $20,030 | $4,800 | $15,230 |
| 2021 | $759 | $19,004 | $4,800 | $14,204 |
| 2020 | $759 | $19,004 | $4,800 | $14,204 |
| 2019 | $678 | $19,004 | $4,800 | $14,204 |
| 2018 | $644 | $17,608 | $4,800 | $12,808 |
| 2017 | $622 | $17,433 | $4,800 | $12,633 |
| 2016 | $633 | $17,433 | $4,800 | $12,633 |
| 2015 | $643 | $17,433 | $4,800 | $12,633 |
| 2014 | $662 | $17,433 | $4,800 | $12,633 |
Source: Public Records
Map
Nearby Homes
- 107 Elizabeth St
- 1414 Lucky St
- 1538 Spring Valley Cir
- 1429 Beatty St
- 1807 Ridge St
- 10 E Mcintosh Rd
- 202 Park St
- 1205 Chardonnay Ln
- 1464 Beatty St
- 339 Main St
- 1527 Ridgewood Dr
- 4038 W Mcintosh Rd
- 1391 Experiment St Unit 12
- 1391 Experiment St
- 1643 Hallmark Hills Dr
- 103 Claire Ct
- 1611 Hallmark Hills Dr
- 304 Kilgore Rd
- 204 Derek Ct
- 221 Bleachery St
- 207 Mobley St
- 113 Mobley St
- 0 Mobley St Unit 7524020
- 0 Mobley St Unit 8954442
- 0 Mobley St Unit 9061404
- 0 Mobley St Unit 9052437
- 0 Mobley St Unit 8796606
- 0 Mobley St Unit 7056430
- 0 Mobley St Unit 7256713
- 0 Mobley St Unit 7347549
- 0 Mobley St Unit 7431884
- 0 Mobley St Unit 7508521
- 0 Mobley St
- 209 Mobley St
- 111 Mobley St
- 204 Mobley St
- 202 Elizabeth St
- 204 Elizabeth St
- 211 Mobley St
- 114 Mobley St