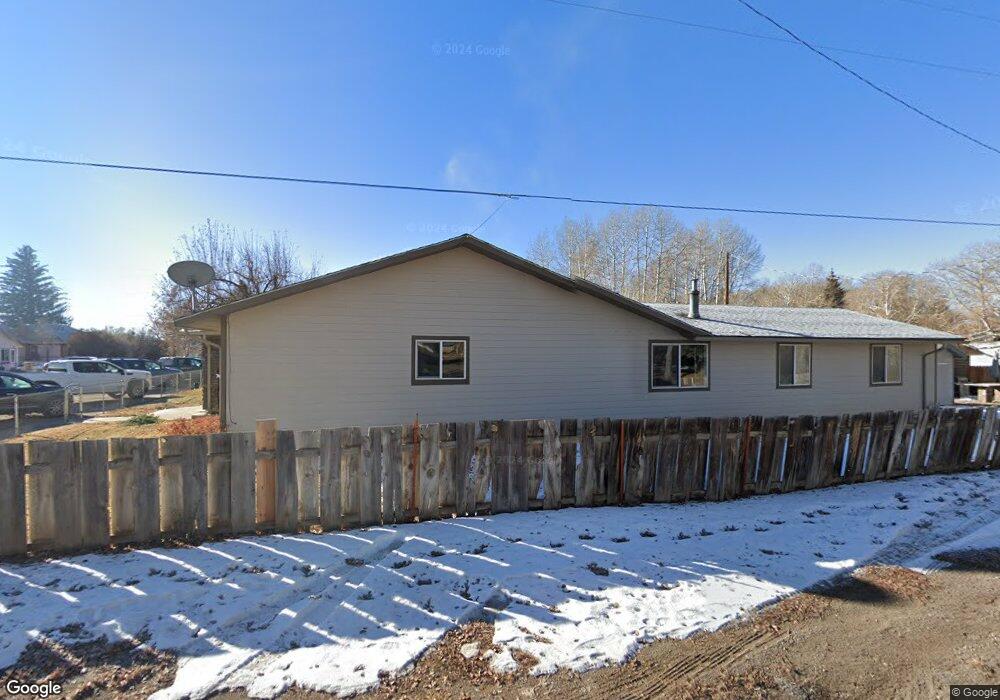
205 Mulberry St La Jara, CO 81140
Estimated Value: $283,712 - $398,000
4
Beds
2
Baths
2,472
Sq Ft
$133/Sq Ft
Est. Value
About This Home
This home is located at 205 Mulberry St, La Jara, CO 81140 and is currently estimated at $328,928, approximately $133 per square foot. 205 Mulberry St is a home with nearby schools including Centauri High School.
Ownership History
Date
Name
Owned For
Owner Type
Purchase Details
Closed on
Jun 11, 2007
Sold by
Mccarroll Robert Scott and Mccarroll Paula
Bought by
Mccarroll Craig and Mccarroll April
Current Estimated Value
Create a Home Valuation Report for This Property
The Home Valuation Report is an in-depth analysis detailing your home's value as well as a comparison with similar homes in the area
Home Values in the Area
Average Home Value in this Area
Purchase History
| Date | Buyer | Sale Price | Title Company |
|---|---|---|---|
| Mccarroll Craig | -- | -- |
Source: Public Records
Tax History Compared to Growth
Tax History
| Year | Tax Paid | Tax Assessment Tax Assessment Total Assessment is a certain percentage of the fair market value that is determined by local assessors to be the total taxable value of land and additions on the property. | Land | Improvement |
|---|---|---|---|---|
| 2024 | $1,063 | $15,202 | $1,005 | $14,197 |
| 2023 | $1,063 | $15,202 | $1,005 | $14,197 |
| 2022 | $1,202 | $13,538 | $695 | $12,843 |
| 2021 | $1,232 | $13,927 | $715 | $13,212 |
| 2020 | $1,051 | $11,233 | $715 | $10,518 |
| 2019 | $927 | $11,233 | $715 | $10,518 |
| 2018 | $919 | $11,583 | $720 | $10,863 |
| 2017 | $927 | $11,583 | $720 | $10,863 |
| 2016 | $1,051 | $13,113 | $796 | $12,317 |
| 2015 | -- | $13,113 | $796 | $12,317 |
| 2014 | -- | $12,140 | $597 | $11,543 |
| 2013 | -- | $12,140 | $597 | $11,543 |
Source: Public Records
Map
Nearby Homes
- 210 Broadway St
- 16648 W.5
- 18163 US Highway 285
- 610 1st St
- 304 4th St
- 455 Hickory St
- 19065 County Road 20
- Lot 16 10th St
- Lot 15 10th St
- TBD County Road Bb
- 20806 County Rd W
- 18772 County Rd S Unit 48 & 49
- 23966 County Road 13
- 15004 County Road 20
- TBD County Road Aa
- 104 Dotson St
- 309 Main St
- 117 N 2nd St
- 00 Colorado 142
- 113 Conejos St
- 610 Main St
- 16442 State Highway 136
- 207 Mulberry St
- 205 2nd St
- 206 Mulberry St
- 115 Mulberry St
- 127 Joe S Chavez Dr
- 219 2nd St
- 106 2nd St
- 123 Joe S. Chavez Dr
- 215 Joe Chavez Dr
- 221 2nd St
- 101 2nd St
- 117 Joe S. Chavez Dr
- 117 Spruce St
- 111 Mulberry St
- 210 1st St
- 111 Joe S. Chavez Dr
- 105 Joe S Chavez Dr
- 215 Joe S Chavez Dr