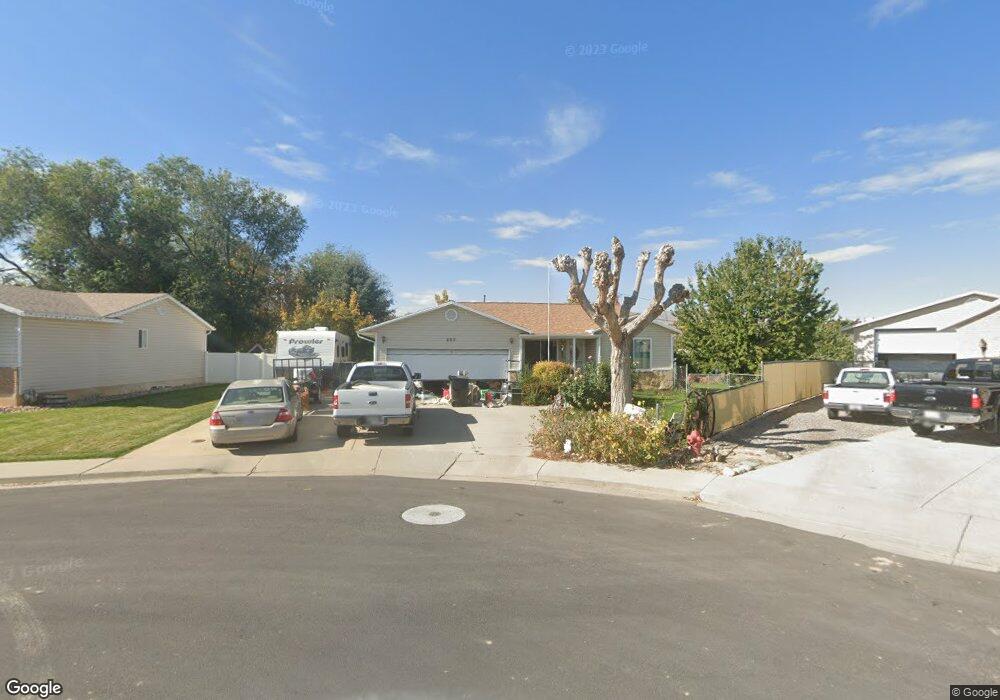
205 N 340 W Payson, UT 84651
Estimated Value: $479,000 - $603,000
4
Beds
4
Baths
3,031
Sq Ft
$172/Sq Ft
Est. Value
About This Home
This home is located at 205 N 340 W, Payson, UT 84651 and is currently estimated at $522,437, approximately $172 per square foot. 205 N 340 W is a home located in Utah County with nearby schools including Taylor Elementary School, Salem Junior High School, and Valley View Middle School.
Ownership History
Date
Name
Owned For
Owner Type
Purchase Details
Closed on
Mar 25, 2005
Sold by
Petersen Karen J Holden and Petersen Dennis J
Bought by
Holden Karen J
Current Estimated Value
Home Financials for this Owner
Home Financials are based on the most recent Mortgage that was taken out on this home.
Original Mortgage
$27,000
Outstanding Balance
$13,861
Interest Rate
5.7%
Mortgage Type
Stand Alone Second
Estimated Equity
$508,576
Purchase Details
Closed on
Oct 4, 2004
Sold by
Christensen Fred and Christensen Susan Marie
Bought by
Holden Karen J
Create a Home Valuation Report for This Property
The Home Valuation Report is an in-depth analysis detailing your home's value as well as a comparison with similar homes in the area
Home Values in the Area
Average Home Value in this Area
Purchase History
| Date | Buyer | Sale Price | Title Company |
|---|---|---|---|
| Holden Karen J | -- | Metro National Title Orem | |
| Holden Karen J | -- | Utah Standard Title |
Source: Public Records
Mortgage History
| Date | Status | Borrower | Loan Amount |
|---|---|---|---|
| Open | Holden Karen J | $27,000 | |
| Open | Holden Karen J | $144,000 |
Source: Public Records
Tax History
| Year | Tax Paid | Tax Assessment Tax Assessment Total Assessment is a certain percentage of the fair market value that is determined by local assessors to be the total taxable value of land and additions on the property. | Land | Improvement |
|---|---|---|---|---|
| 2025 | $2,387 | $271,040 | -- | -- |
| 2024 | $2,387 | $242,880 | $0 | $0 |
| 2023 | $2,367 | $241,505 | $0 | $0 |
| 2022 | $2,455 | $246,455 | $0 | $0 |
| 2021 | $2,083 | $335,400 | $94,900 | $240,500 |
| 2020 | $1,978 | $311,500 | $86,300 | $225,200 |
| 2019 | $1,798 | $290,400 | $77,300 | $213,100 |
| 2018 | $1,655 | $257,600 | $69,000 | $188,600 |
| 2017 | $1,462 | $122,375 | $0 | $0 |
| 2016 | $1,417 | $117,865 | $0 | $0 |
| 2015 | $1,356 | $111,980 | $0 | $0 |
| 2014 | $1,336 | $111,155 | $0 | $0 |
Source: Public Records
Map
Nearby Homes
- 416 N 250 W
- 116 S 300 W
- 588 W Utah Ave
- 128 S 300 W
- 451 N 500 W
- 845 W 400 N
- 383 W 625 N Unit A-D
- 384 W 650 N Unit A-D
- 116 E 100 S
- 390 N 200 E
- 387 N 300 E
- 361 W 625 N Unit A-D
- 1287 N 1390 E Unit 25-96
- 9672 S 3550 W
- 433 E 450 N
- 443 E 450 N
- 219 S Majestic W
- 221 S Majestic Meadows Dr
- 252 S 400 E
- 446 N 460 E Unit 9