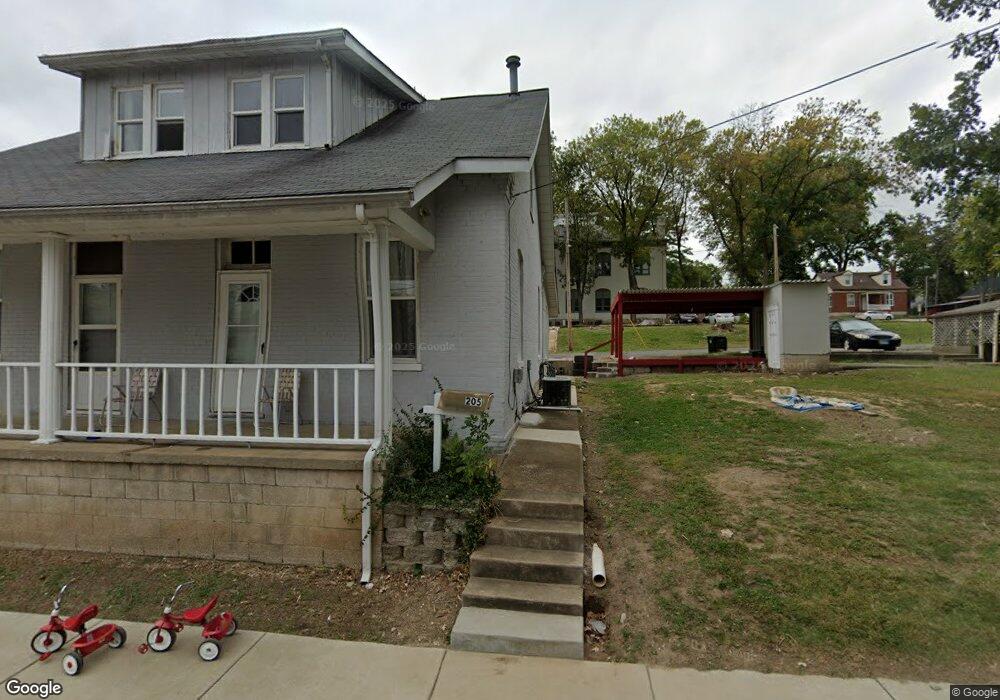
205 N 8th St Belleville, IL 62220
Estimated Value: $65,000 - $118,000
1
Bed
1
Bath
1,000
Sq Ft
$89/Sq Ft
Est. Value
About This Home
This home is located at 205 N 8th St, Belleville, IL 62220 and is currently estimated at $88,674, approximately $88 per square foot. 205 N 8th St is a home located in St. Clair County with nearby schools including Franklin Elementary School, Central Jr High School, and Governor French Academy.
Ownership History
Date
Name
Owned For
Owner Type
Purchase Details
Closed on
Jul 6, 2023
Sold by
Buss Jason E
Bought by
Laketop Properties Llc
Current Estimated Value
Home Financials for this Owner
Home Financials are based on the most recent Mortgage that was taken out on this home.
Original Mortgage
$108,000
Outstanding Balance
$105,317
Interest Rate
6.57%
Mortgage Type
Commercial
Estimated Equity
-$16,643
Purchase Details
Closed on
Aug 29, 2022
Sold by
M51 Llc
Bought by
Buss Jason E
Purchase Details
Closed on
Apr 24, 2014
Sold by
Mathews Cheryl A and Mathews Billy R
Bought by
M5i Llc
Purchase Details
Closed on
Dec 29, 2006
Sold by
Erlinger Stanlee G
Bought by
Mathews Billy
Home Financials for this Owner
Home Financials are based on the most recent Mortgage that was taken out on this home.
Original Mortgage
$54,800
Interest Rate
6.24%
Mortgage Type
Purchase Money Mortgage
Create a Home Valuation Report for This Property
The Home Valuation Report is an in-depth analysis detailing your home's value as well as a comparison with similar homes in the area
Home Values in the Area
Average Home Value in this Area
Purchase History
| Date | Buyer | Sale Price | Title Company |
|---|---|---|---|
| Laketop Properties Llc | $135,000 | Town & Country Title | |
| Buss Jason E | $30,000 | Town & Country Title | |
| M5i Llc | -- | None Available | |
| Mathews Billy | $68,500 | Freedom Title |
Source: Public Records
Mortgage History
| Date | Status | Borrower | Loan Amount |
|---|---|---|---|
| Open | Laketop Properties Llc | $108,000 | |
| Previous Owner | Mathews Billy | $54,800 |
Source: Public Records
Tax History Compared to Growth
Tax History
| Year | Tax Paid | Tax Assessment Tax Assessment Total Assessment is a certain percentage of the fair market value that is determined by local assessors to be the total taxable value of land and additions on the property. | Land | Improvement |
|---|---|---|---|---|
| 2024 | $252 | $2,863 | $1,703 | $1,160 |
| 2023 | $252 | $2,680 | $1,668 | $1,012 |
| 2022 | $231 | $2,413 | $1,502 | $911 |
| 2021 | $222 | $2,231 | $1,389 | $842 |
| 2020 | $216 | $2,109 | $1,313 | $796 |
| 2019 | $223 | $2,151 | $1,315 | $836 |
| 2018 | $218 | $2,105 | $1,287 | $818 |
| 2017 | $216 | $2,091 | $1,278 | $813 |
| 2016 | $214 | $2,047 | $1,251 | $796 |
| 2014 | $256 | $2,767 | $1,948 | $819 |
| 2013 | $253 | $2,807 | $1,976 | $831 |
Source: Public Records
Map
Nearby Homes