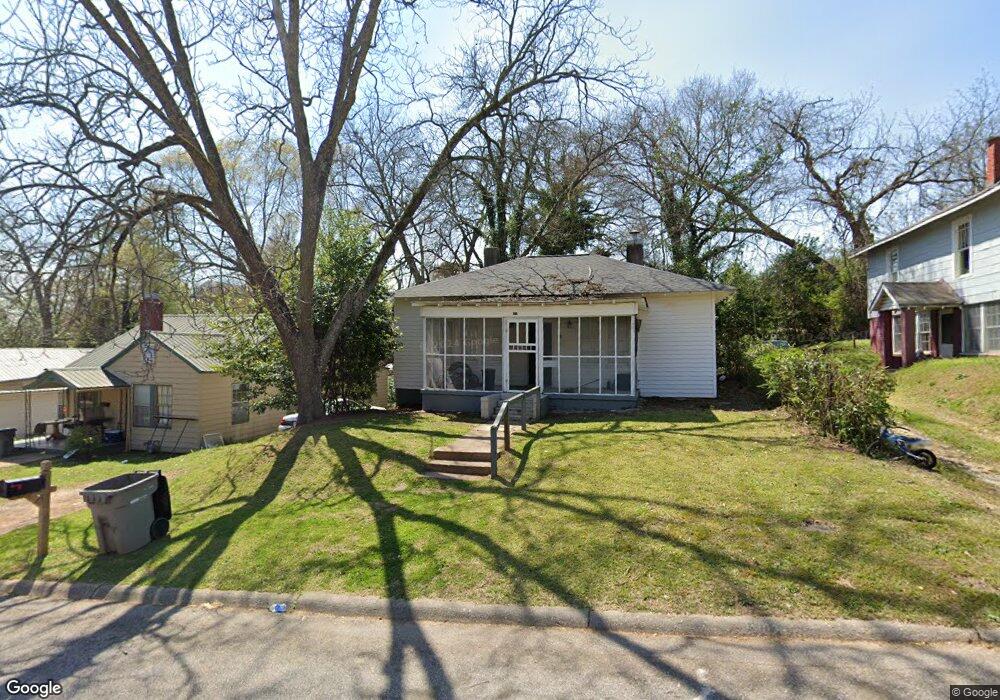
205 N Dawson St Lagrange, GA 30241
Estimated Value: $71,000 - $110,412
About This Home
This home is located at 205 N Dawson St, Lagrange, GA 30241 and is currently estimated at $94,603, approximately $81 per square foot. 205 N Dawson St is a home located in Troup County with nearby schools including Hollis Hand Elementary School, Franklin Forest Elementary School, and Ethel W. Kight Elementary School.
Ownership History
We collect this data history from publicly available records. To have your information removed, we recommend requesting removal directly through your county’s website.
Purchase Details
Purchase Details
Purchase Details
Home Financials for this Owner
Home Financials are based on the most recent Mortgage that was taken out on this home.Purchase Details
Purchase Details
Purchase Details
Purchase History
We collect this data history from publicly available records. To have your information removed, we recommend requesting removal directly through your county’s website.
| Date | Buyer | Sale Price | Title Company |
|---|---|---|---|
| $23,000 | -- | ||
| $9,000 | -- | ||
| $18,000 | -- | ||
| $3,700 | -- | ||
| $18,300 | -- | ||
| -- | -- |
Mortgage History
We collect this data history from publicly available records. To have your information removed, we recommend requesting removal directly through your county’s website.
| Date | Status | Borrower | Loan Amount |
|---|---|---|---|
| Previous Owner | $10,000 |
Tax History
We collect this data history from publicly available records. To have your information removed, we recommend requesting removal directly through your county’s website.
| Year | Tax Paid | Tax Assessment Tax Assessment Total Assessment is a certain percentage of the fair market value that is determined by local assessors to be the total taxable value of land and additions on the property. | Land | Improvement |
|---|---|---|---|---|
| 2025 | $725 | $26,600 | $3,000 | $23,600 |
| 2024 | $670 | $24,560 | $3,000 | $21,560 |
| 2023 | $572 | $20,960 | $3,000 | $17,960 |
| 2022 | $555 | $19,880 | $3,000 | $16,880 |
| 2021 | $277 | $12,040 | $3,000 | $9,040 |
| 2020 | $230 | $7,640 | $3,000 | $4,640 |
| 2019 | $233 | $7,720 | $2,400 | $5,320 |
| 2018 | $157 | $10,280 | $3,600 | $6,680 |
| 2017 | $310 | $10,280 | $3,600 | $6,680 |
| 2016 | $336 | $11,138 | $3,600 | $7,538 |
| 2015 | $320 | $10,576 | $3,038 | $7,538 |
| 2014 | $308 | $10,179 | $3,038 | $7,141 |
| 2013 | -- | $12,103 | $3,038 | $9,064 |
Map
- 803 1/2 Hines St
- 622 Arthur St
- 801 Hines St
- 131 Foch St
- 121 de Groat St
- 301 E Bacon St
- 208 Render St
- 228 E Render St
- 706 N Harlem Cir
- LOT 58 Belk St
- 119 Belk St
- LOT 65 Belk St
- LOT 66 Belk St
- 903 Georgia Ave
- 609 Ridley Ave
- 707 Ridley Ave
- 611 Ridley Ave
- 615 Ridley Ave
- 709 Ridley Ave
- 0 Ridley Ave Unit 10550104
- N N Dawson St
- 203 N Dawson St
- 207 N Dawson St
- 201 N Dawson St
- 109 N Dawson St
- 100 Doughtery St
- 110 Doughtery St
- 114 Doughtery St
- 112 Doughtery St
- 106 Dougherty St Unit 8
- 108 N Dawson St
- 118 de Groat St
- 105 Doughtery St
- 111 Doughtery St
- 118 Dougherty St
- 107 N Dawson St
- 214 N Dawson St
- 308 Hill St
- 113 Dougherty St
- 98 Doughtery St
Ask me questions while you tour the home.