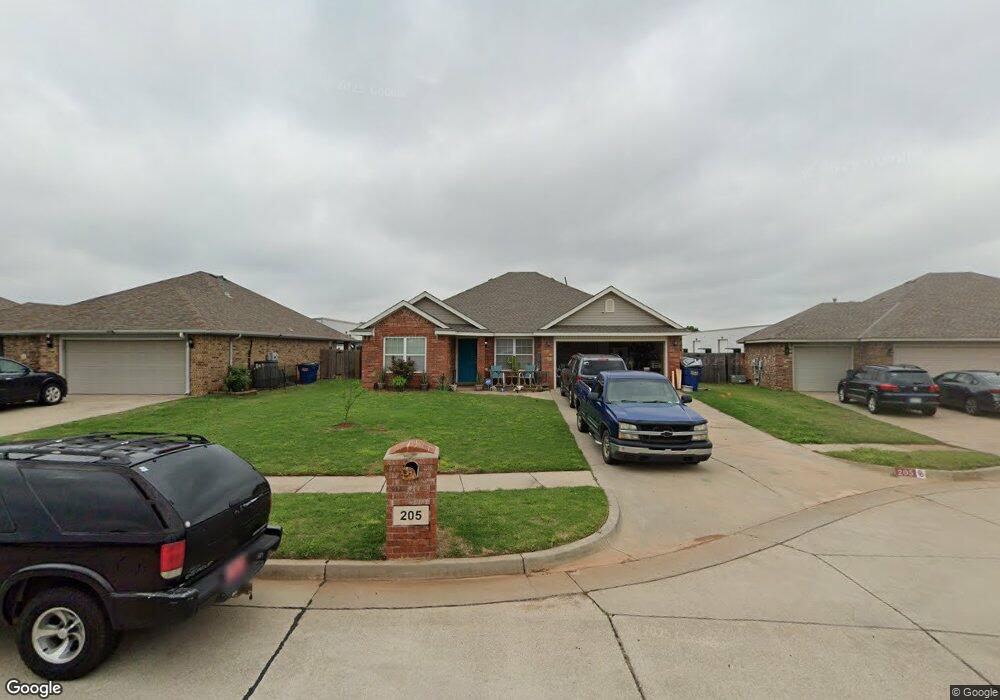
205 N Silver Way Mustang, OK 73064
Estimated Value: $222,000 - $242,000
3
Beds
2
Baths
1,490
Sq Ft
$155/Sq Ft
Est. Value
About This Home
This home is located at 205 N Silver Way, Mustang, OK 73064 and is currently estimated at $230,604, approximately $154 per square foot. 205 N Silver Way is a home located in Canadian County with nearby schools including Mustang Lakehoma Elementary School, Mustang Horizon Intermediate School, and Mustang Middle School.
Ownership History
Date
Name
Owned For
Owner Type
Purchase Details
Closed on
Oct 28, 2019
Sold by
Crank Ryan and Crank Jamie
Bought by
Leblanc Investments Llc
Current Estimated Value
Purchase Details
Closed on
May 16, 2011
Sold by
Crank Ryan and Crank Jamie
Bought by
Crank Ryan and Crank Jamie
Purchase Details
Closed on
Dec 20, 2010
Sold by
Rausch Coleman Homes Okc L L C
Bought by
Crank Ryan
Home Financials for this Owner
Home Financials are based on the most recent Mortgage that was taken out on this home.
Original Mortgage
$132,295
Interest Rate
4.4%
Mortgage Type
FHA
Purchase Details
Closed on
Apr 21, 2010
Sold by
Elite Construction Llc
Bought by
Rausch Coleman Homes Okc Llc
Create a Home Valuation Report for This Property
The Home Valuation Report is an in-depth analysis detailing your home's value as well as a comparison with similar homes in the area
Home Values in the Area
Average Home Value in this Area
Purchase History
| Date | Buyer | Sale Price | Title Company |
|---|---|---|---|
| Leblanc Investments Llc | $135,000 | Oklahoma City Abstract & Ttl | |
| Crank Ryan | -- | American Eagle Title Insuran | |
| Crank Ryan | $139,000 | American Eagle Title Ins Co | |
| Rausch Coleman Homes Okc Llc | $75,000 | Fatco |
Source: Public Records
Mortgage History
| Date | Status | Borrower | Loan Amount |
|---|---|---|---|
| Previous Owner | Crank Ryan | $132,295 |
Source: Public Records
Tax History Compared to Growth
Tax History
| Year | Tax Paid | Tax Assessment Tax Assessment Total Assessment is a certain percentage of the fair market value that is determined by local assessors to be the total taxable value of land and additions on the property. | Land | Improvement |
|---|---|---|---|---|
| 2024 | $2,008 | $21,128 | $3,000 | $18,128 |
| 2023 | $2,008 | $20,122 | $3,000 | $17,122 |
| 2022 | $1,935 | $19,164 | $3,000 | $16,164 |
| 2021 | $1,850 | $18,251 | $3,000 | $15,251 |
| 2020 | $1,773 | $17,382 | $3,000 | $14,382 |
| 2019 | $1,670 | $17,374 | $3,000 | $14,374 |
| 2018 | $1,654 | $16,868 | $3,000 | $13,868 |
| 2017 | $1,635 | $16,868 | $3,000 | $13,868 |
| 2016 | $1,623 | $16,716 | $3,000 | $13,716 |
| 2015 | -- | $17,490 | $3,000 | $14,490 |
| 2014 | -- | $16,981 | $3,000 | $13,981 |
Source: Public Records
Map
Nearby Homes
- 304 N Geronimo Way
- 531 W Shadow Ridge Way
- 557 W Pine Rose Court Way
- 534 W Pine Rose Court Way
- 601 N Chisholm Trail Way
- 500 N Remington Way
- 608 N Remington Way
- 413 W Pines Way
- 0 N Czech Hall Rd
- 844 W Forest Dr
- 338 W Crooked Branch Way
- 433 W Forest Dr
- 912 N Barn Hill Way
- 3629 Blue Ave
- 3641 Pete St
- 3637 Blue Ave
- 350 W Elder Dr
- 2017 W Autumn Way
- 805 W Old Farm Way
- 913 N Kirk Way
- 205 N Silver Way
- 201 N Silver Way
- 209 N Silver Way
- 117 N Silver Way
- 204 N Silver Way
- 113 N Silver Way
- 200 N Silver Way
- 627 W Shadow Ridge Way
- 112 N Silver Way
- 109 N Silver Way
- 636 Alamo Way
- 632 Alamo Way
- 700 Alamo Way
- 108 N Silver Way
- 120 Chisholm Trail Way
- 704 Alamo Way
- 628 Alamo Way
- 205 N Shady Court Way
- 105 N Silver Way
- 120 W Chisholm Trail Way