Estimated Value: $40,027
Studio
1
Bath
300
Sq Ft
$133/Sq Ft
Est. Value
About This Home
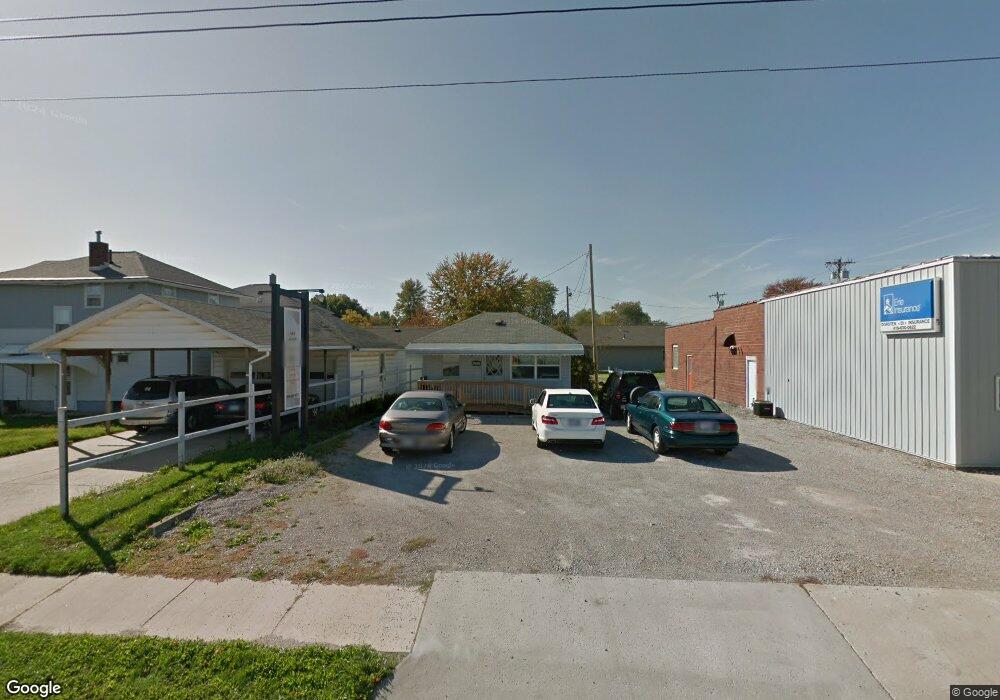
This home is located at 205 N Union St, Bryan, OH 43506 and is currently estimated at $40,027, approximately $133 per square foot. 205 N Union St is a home located in Williams County with nearby schools including Bryan Elementary PK-5, Washington Elementary School, and Bryan Middle School/High School.
Ownership History
Date
Name
Owned For
Owner Type
Purchase Details
Closed on
Feb 22, 2018
Sold by
Albertson Robert L and Albertson Rebecca J
Bought by
Dmc Real Estate L L C
Current Estimated Value
Purchase Details
Closed on
Sep 16, 2011
Sold by
Funk Jonne
Bought by
Albertson Robert L and Albertson Rebecca J
Purchase Details
Closed on
Jun 3, 2008
Sold by
Funk Joanne
Bought by
Funk Joanne
Purchase Details
Closed on
Oct 15, 2003
Bought by
Mattingly Janet Rose Trustee
Purchase Details
Closed on
Oct 24, 2000
Sold by
Kunsman Sam L
Bought by
Mattingly Janet Rose Revocable Livi
Purchase Details
Closed on
Jan 31, 1997
Sold by
Kunsman Sam and Kunsman Jeri L
Bought by
Kunsman Sam L
Purchase Details
Closed on
Sep 2, 1994
Bought by
Kunsman Sam and Kunsman Jeri L
Create a Home Valuation Report for This Property
The Home Valuation Report is an in-depth analysis detailing your home's value as well as a comparison with similar homes in the area
Home Values in the Area
Average Home Value in this Area
Purchase History
| Date | Buyer | Sale Price | Title Company |
|---|---|---|---|
| Dmc Real Estate L L C | $22,000 | Title Assurance Group Ltd | |
| Albertson Robert L | $14,000 | None Available | |
| Funk Joanne | -- | None Available | |
| Mattingly Janet Rose Trustee | -- | -- | |
| Mattingly Janet Rose Revocable Livi | $25,000 | -- | |
| Kunsman Sam L | -- | -- | |
| Kunsman Sam | $17,500 | -- |
Source: Public Records
Tax History
| Year | Tax Paid | Tax Assessment Tax Assessment Total Assessment is a certain percentage of the fair market value that is determined by local assessors to be the total taxable value of land and additions on the property. | Land | Improvement |
|---|---|---|---|---|
| 2025 | $296 | $5,150 | $3,710 | $1,440 |
| 2024 | $296 | $5,150 | $3,710 | $1,440 |
| 2023 | $298 | $4,870 | $3,330 | $1,540 |
| 2022 | $311 | $4,870 | $3,330 | $1,540 |
| 2021 | $311 | $4,870 | $3,330 | $1,540 |
| 2020 | $319 | $4,870 | $3,330 | $1,540 |
| 2019 | $312 | $4,870 | $3,330 | $1,540 |
| 2018 | $309 | $4,870 | $3,330 | $1,540 |
| 2017 | $309 | $4,800 | $3,330 | $1,470 |
| 2016 | $298 | $4,800 | $3,330 | $1,470 |
| 2015 | $294 | $4,800 | $3,330 | $1,470 |
| 2014 | $294 | $4,800 | $3,330 | $1,470 |
| 2013 | $293 | $4,800 | $3,330 | $1,470 |
Source: Public Records
Map
Nearby Homes
- 330 N Emmett St
- 216 N Allen St
- 206 Glen Arbor Dr
- 315 N Williams St
- 319 N Williams St
- 310 E Edgerton St
- 404 E Wilson St
- 202 Sycamore Ln
- 4637 County Road 15 75
- 4739 County Road 15 75
- 4705 County Road 1575
- 1901 South Ct
- 0 Lynn St Unit 6110702
- 228 N Beech St
- 128 N Beech St
- 422 S Main St
- 716 S Walnut St
- 411 E South St
- 323 E South St
- 821 S Main St
- 925 E Bryan St
- 209 N Union St
- 921 E Bryan St
- 210 N Union St
- 911 E Bryan St
- 909 E Bryan St
- 907 E Bryan St
- 910 E Mulberry St
- 905 E Bryan St
- 902 E Mulberry St
- 925 E Mulberry St
- 904 E Mulberry St
- 304 N Union St
- 907 E Mulberry St
- 315 N Union St
- 884 E Mulberry St
- 885 E Bryan St
- 106 N Union St
- 886 E Bryan St
Your Personal Tour Guide
Ask me questions while you tour the home.