Estimated Value: $208,000 - $277,000
4
Beds
2
Baths
1,762
Sq Ft
$135/Sq Ft
Est. Value
About This Home
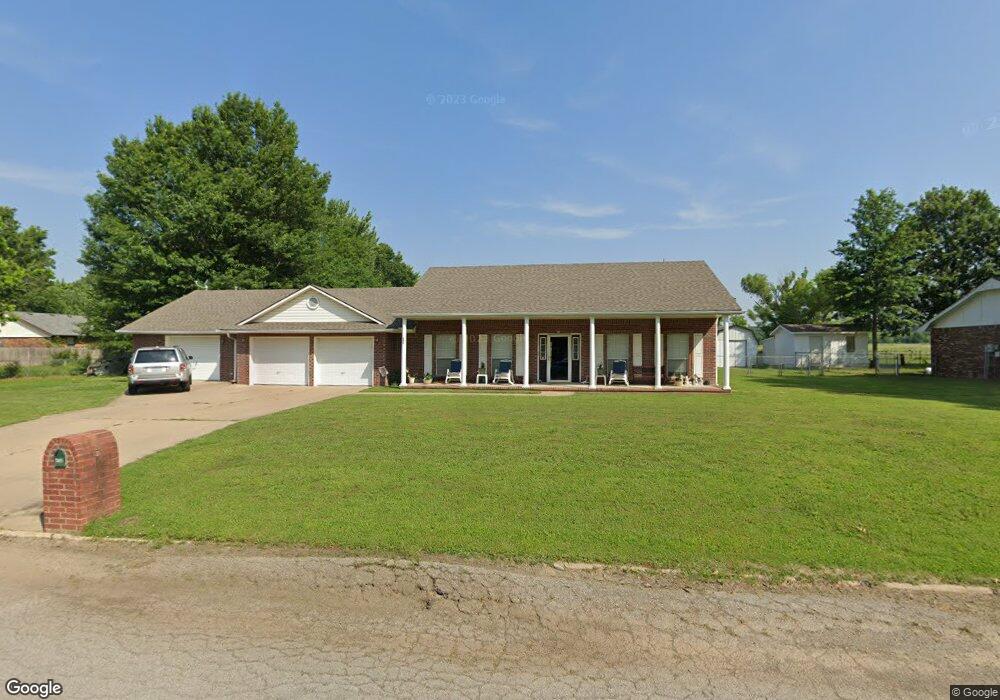
This home is located at 205 NE 3rd St, Inola, OK 74036 and is currently estimated at $238,616, approximately $135 per square foot. 205 NE 3rd St is a home located in Rogers County with nearby schools including Inola Elementary School, Inola Middle School, and Inola High School.
Ownership History
Date
Name
Owned For
Owner Type
Purchase Details
Closed on
Oct 30, 2014
Sold by
Green Clarence F
Bought by
Bell Calvin
Current Estimated Value
Purchase Details
Closed on
Sep 20, 2006
Sold by
Green Clarence F and Green Jane L
Bought by
Green Clarence F and Green Jane L
Purchase Details
Closed on
Oct 8, 2004
Sold by
Applegate Carole J
Purchase Details
Closed on
Nov 5, 1999
Sold by
Whitworth Roy J and Whitworth Gail~Sue
Purchase Details
Closed on
Jul 14, 1995
Sold by
Fleming William Paul
Create a Home Valuation Report for This Property
The Home Valuation Report is an in-depth analysis detailing your home's value as well as a comparison with similar homes in the area
Home Values in the Area
Average Home Value in this Area
Purchase History
| Date | Buyer | Sale Price | Title Company |
|---|---|---|---|
| Bell Calvin | $150,000 | -- | |
| Green Clarence F | -- | None Available | |
| -- | $152,000 | -- | |
| -- | $132,500 | -- | |
| -- | $14,000 | -- |
Source: Public Records
Tax History Compared to Growth
Tax History
| Year | Tax Paid | Tax Assessment Tax Assessment Total Assessment is a certain percentage of the fair market value that is determined by local assessors to be the total taxable value of land and additions on the property. | Land | Improvement |
|---|---|---|---|---|
| 2024 | $1,660 | $21,650 | $1,505 | $20,145 |
| 2023 | $1,612 | $21,020 | $1,375 | $19,645 |
| 2022 | $1,655 | $20,408 | $1,375 | $19,033 |
| 2021 | $1,557 | $19,436 | $1,375 | $18,061 |
| 2020 | $1,621 | $20,195 | $1,375 | $18,820 |
| 2019 | $1,579 | $19,107 | $1,375 | $17,732 |
| 2018 | $1,644 | $19,688 | $1,375 | $18,313 |
| 2017 | $1,642 | $19,516 | $1,375 | $18,141 |
| 2016 | $1,615 | $18,977 | $1,375 | $17,602 |
| 2015 | $1,648 | $18,352 | $1,375 | $16,977 |
| 2014 | $1,205 | $14,421 | $1,061 | $13,360 |
Source: Public Records
Map
Nearby Homes
- 12 1st St NE
- 125 C St SE
- 113 W Commercial St
- 16 B St NW
- 25 Dylan Dr
- 0 E 590 Unit 2537305
- 0 N 4220 Rd Unit 2533064
- 28 Riding St
- 458 Heather Dr
- 0 U S Highway 412
- 18265 E 610 Rd
- 32767 S 4220 Rd
- 19700 E 600
- 30905 S Public St
- 16644 E Kings Place
- 0 S 4200 Rd Unit 2536621
- 18350 E 615 Rd
- 33805 S 4214 Rd
- 20354 E 580 Rd
- 15536 E Anderson Dr