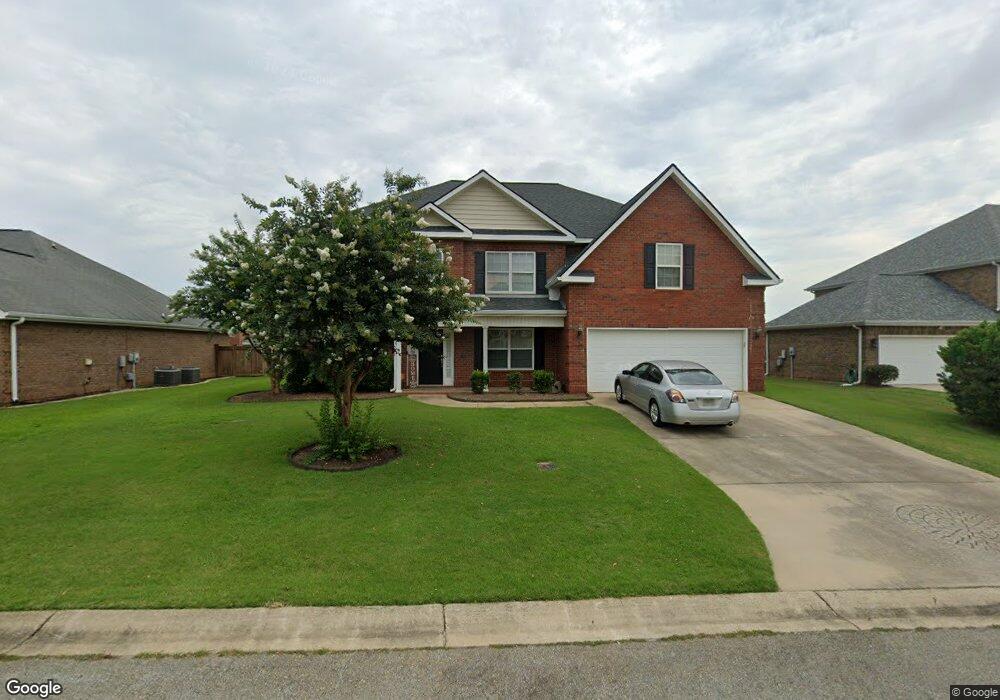
205 Northumberland Way Warner Robins, GA 31088
Estimated Value: $376,304 - $424,000
5
Beds
3
Baths
3,156
Sq Ft
$129/Sq Ft
Est. Value
About This Home
This home is located at 205 Northumberland Way, Warner Robins, GA 31088 and is currently estimated at $406,326, approximately $128 per square foot. 205 Northumberland Way is a home located in Houston County with nearby schools including Lake Joy Primary School, Lake Joy Elementary School, and Feagin Mill Middle School.
Ownership History
Date
Name
Owned For
Owner Type
Purchase Details
Closed on
Jun 8, 2018
Sold by
Smith Talmadge and Smith Stephanie
Bought by
Hillard Gabriel J and Hillard Dennice L
Current Estimated Value
Home Financials for this Owner
Home Financials are based on the most recent Mortgage that was taken out on this home.
Original Mortgage
$268,580
Outstanding Balance
$232,277
Interest Rate
4.5%
Mortgage Type
VA
Estimated Equity
$174,049
Purchase Details
Closed on
Feb 19, 2008
Sold by
Henderson Property Management Llc
Bought by
Smith Talmadge A and Smith Stephanie S
Purchase Details
Closed on
Feb 9, 2007
Sold by
Mike L Moon Enterprises Llc
Bought by
Henderson Property Management Llc
Purchase Details
Closed on
Jan 2, 2007
Sold by
Stagecoach Enterprises Inc
Bought by
Mike L Moon Enterprises Llc
Create a Home Valuation Report for This Property
The Home Valuation Report is an in-depth analysis detailing your home's value as well as a comparison with similar homes in the area
Home Values in the Area
Average Home Value in this Area
Purchase History
| Date | Buyer | Sale Price | Title Company |
|---|---|---|---|
| Hillard Gabriel J | $260,000 | None Available | |
| Smith Talmadge A | -- | None Available | |
| Henderson Property Management Llc | $40,800 | -- | |
| Mike L Moon Enterprises Llc | $28,500 | -- |
Source: Public Records
Mortgage History
| Date | Status | Borrower | Loan Amount |
|---|---|---|---|
| Open | Hillard Gabriel J | $268,580 |
Source: Public Records
Tax History Compared to Growth
Tax History
| Year | Tax Paid | Tax Assessment Tax Assessment Total Assessment is a certain percentage of the fair market value that is determined by local assessors to be the total taxable value of land and additions on the property. | Land | Improvement |
|---|---|---|---|---|
| 2024 | $4,414 | $134,880 | $20,000 | $114,880 |
| 2023 | $3,969 | $120,360 | $20,000 | $100,360 |
| 2022 | $2,761 | $120,080 | $20,000 | $100,080 |
| 2021 | $2,443 | $105,680 | $18,000 | $87,680 |
| 2020 | $2,301 | $99,040 | $18,000 | $81,040 |
| 2019 | $2,301 | $99,040 | $18,000 | $81,040 |
| 2018 | $2,254 | $99,040 | $18,000 | $81,040 |
| 2017 | $2,164 | $95,040 | $14,000 | $81,040 |
| 2016 | $2,167 | $95,040 | $14,000 | $81,040 |
| 2015 | -- | $95,040 | $14,000 | $81,040 |
| 2014 | -- | $95,040 | $14,000 | $81,040 |
| 2013 | -- | $95,040 | $14,000 | $81,040 |
Source: Public Records
Map
Nearby Homes
- 207 Northumberland Way
- 203 Northumberland Way
- 300 Staffordshire Ave
- 209 Northumberland Way
- 209 Northumberland (16b) Way
- 302 Staffordshire Ave
- 204 Northumberland Way
- 0 Northumberland Way Unit 8792417
- 0 Northumberland Way Unit 3196712
- 0 Northumberland Way
- 202 Northumberland Way
- 202 Northumberland Way Unit 126
- 206 Northumberland Way
- 206 Staffordshire Ave
- 208 Northumberland Way
- 200 Northumberland Way
- 204 Staffordshire Ave
- 210 Northumberland Way (15b)
- Lot#25 Staffordshire Ave
- 0 Staffordshire Ave Unit 3111703