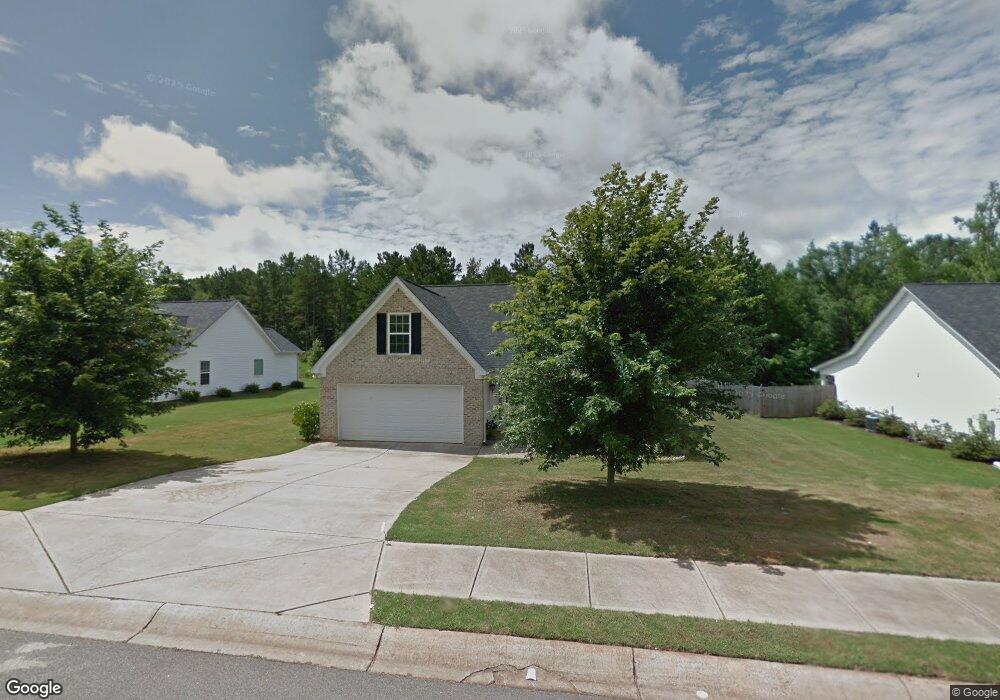
205 Perimeter Dr Lagrange, GA 30241
Estimated Value: $248,067 - $279,000
3
Beds
2
Baths
1,720
Sq Ft
$149/Sq Ft
Est. Value
About This Home
This home is located at 205 Perimeter Dr, Lagrange, GA 30241 and is currently estimated at $257,017, approximately $149 per square foot. 205 Perimeter Dr is a home located in Troup County with nearby schools including Callaway Elementary School, Hogansville Elementary School, and Callaway Middle School.
Ownership History
Date
Name
Owned For
Owner Type
Purchase Details
Closed on
Jul 2, 2021
Sold by
Chang Chinjui
Bought by
Lee Jin Woo and Lee Phyong Yun
Current Estimated Value
Purchase Details
Closed on
Nov 1, 2007
Sold by
Chang Chinjui
Bought by
Chang Ying Yu Tao
Home Financials for this Owner
Home Financials are based on the most recent Mortgage that was taken out on this home.
Original Mortgage
$137,600
Interest Rate
6.26%
Mortgage Type
New Conventional
Purchase Details
Closed on
Oct 31, 2007
Sold by
Scott Hayes Construction I
Bought by
Chang Chinjui
Home Financials for this Owner
Home Financials are based on the most recent Mortgage that was taken out on this home.
Original Mortgage
$137,600
Interest Rate
6.26%
Mortgage Type
New Conventional
Purchase Details
Closed on
Oct 9, 2006
Sold by
Necon Inc
Bought by
Scott Hayes Construction Inc
Create a Home Valuation Report for This Property
The Home Valuation Report is an in-depth analysis detailing your home's value as well as a comparison with similar homes in the area
Purchase History
| Date | Buyer | Sale Price | Title Company |
|---|---|---|---|
| Lee Jin Woo | $170,000 | -- | |
| Chang Ying Yu Tao | -- | -- | |
| Chang Chinjui | $172,000 | -- | |
| Scott Hayes Construction Inc | $222,000 | -- |
Source: Public Records
Mortgage History
| Date | Status | Borrower | Loan Amount |
|---|---|---|---|
| Previous Owner | Chang Ying Yu Tao | $137,600 | |
| Previous Owner | Chang Chinjui | $137,600 |
Source: Public Records
Tax History
| Year | Tax Paid | Tax Assessment Tax Assessment Total Assessment is a certain percentage of the fair market value that is determined by local assessors to be the total taxable value of land and additions on the property. | Land | Improvement |
|---|---|---|---|---|
| 2025 | $2,290 | $96,240 | $14,000 | $82,240 |
| 2024 | $2,290 | $83,960 | $14,000 | $69,960 |
| 2023 | $2,247 | $82,400 | $14,000 | $68,400 |
| 2022 | $1,898 | $68,240 | $10,000 | $58,240 |
| 2021 | $1,963 | $65,080 | $10,000 | $55,080 |
| 2020 | $1,903 | $63,080 | $8,000 | $55,080 |
| 2019 | $1,883 | $62,440 | $8,000 | $54,440 |
| 2018 | $1,830 | $60,680 | $10,000 | $50,680 |
| 2017 | $1,709 | $56,680 | $6,000 | $50,680 |
| 2016 | $1,741 | $57,718 | $6,000 | $51,718 |
| 2015 | $1,744 | $57,718 | $6,000 | $51,718 |
| 2014 | $1,499 | $49,552 | $6,000 | $43,552 |
| 2013 | -- | $54,514 | $6,000 | $48,514 |
Source: Public Records
Map
Nearby Homes
- 789 Hammett Rd
- 883 Hammett Rd
- 300 Old Pond Rd
- SMOKEMONT Smokemont Dr
- 200 Crestwood Dr
- 124 Woodridge Cir
- 519 Tradition Place
- 105 Ridgefield Dr
- 517 Tradition Place
- 112 Celebration Blvd
- 101 Sheffield Dr
- 129 Celebration Blvd
- 793 Celebration Blvd
- 100 Canterbury Dr
- 102 Canterbury Dr
- 509 Youngs Mill Rd
- 104 Canterbury Dr
- 119 Sir Lancelot St
- 101 Sarah Ln
- 227 River Meadow Dr
- 203 Perimeter Dr
- 207 Perimeter Dr
- 209 Perimeter Dr Unit LOT 19
- 201 Perimeter Dr
- 206 Perimeter Dr
- 204 Perimeter Dr
- 202 Perimeter Dr
- 211 Perimeter Dr
- 208 Perimeter Dr
- 200 Perimeter Dr
- 115 Perimeter Dr
- 213 Perimeter Dr
- 210 Perimeter Dr
- 210 Perimeter Dr
- 210 Perimeter Dr Unit 223
- 305 N Pointe Dr Unit 228
- 305 N Pointe Dr
- 303 N Pointe Dr Unit 229
- 303 N Pointe Dr
- 307 North Pointe Dr
Your Personal Tour Guide
Ask me questions while you tour the home.