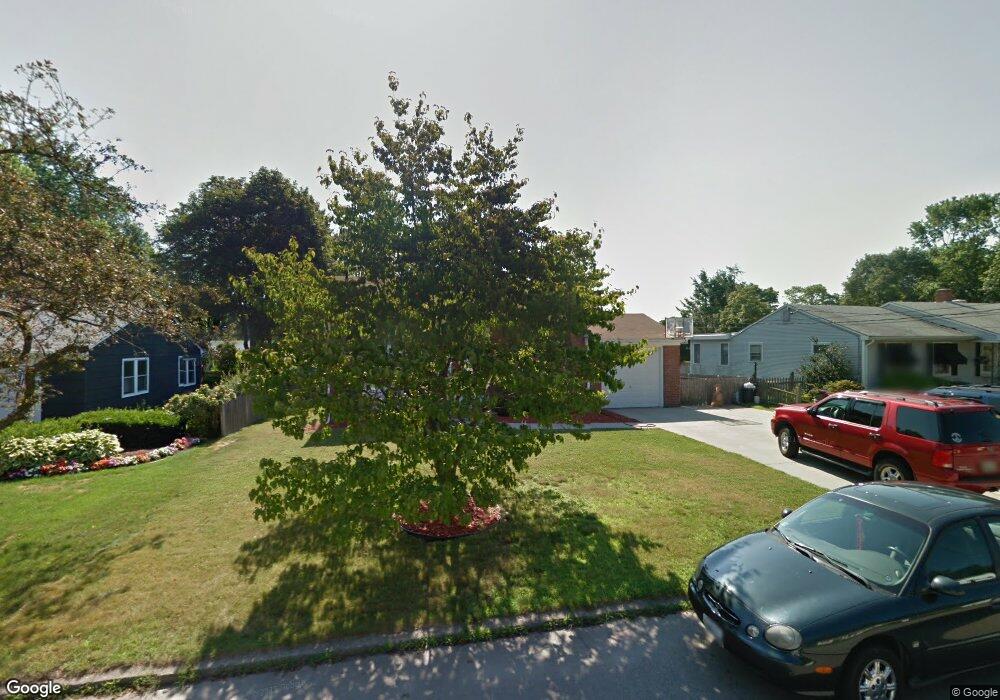
205 Pinecrest Dr Pawtucket, RI 02861
Darlington NeighborhoodEstimated Value: $404,000 - $524,000
3
Beds
2
Baths
1,904
Sq Ft
$242/Sq Ft
Est. Value
About This Home
This home is located at 205 Pinecrest Dr, Pawtucket, RI 02861 and is currently estimated at $461,068, approximately $242 per square foot. 205 Pinecrest Dr is a home located in Providence County with nearby schools including St Cecilia School and Dayspring Christian Academy.
Ownership History
Date
Name
Owned For
Owner Type
Purchase Details
Closed on
May 27, 2020
Sold by
Labree Ronald J and Labree Barbara J
Bought by
Ronald J Labree Jr Lt
Current Estimated Value
Purchase Details
Closed on
Jan 14, 2020
Sold by
Ronald J Labree Jr Lt
Bought by
Labree Ronald J and Labree Barbara J
Purchase Details
Closed on
Oct 25, 2018
Sold by
Labree Ronald J and Labree Barbara J
Bought by
Barbara J Labree Lt
Purchase Details
Closed on
Mar 15, 1996
Sold by
Cadoret Mark S and Antinucci Jennifer J
Bought by
Labree Ronald J and Labree Barbara
Purchase Details
Closed on
Jun 30, 1995
Sold by
Schupp John D
Bought by
Cadoret Mark S and Antinucci Jennifer J
Purchase Details
Closed on
Sep 19, 1994
Sold by
Equitable Cu
Bought by
Schupp John D and Schupp Paula
Create a Home Valuation Report for This Property
The Home Valuation Report is an in-depth analysis detailing your home's value as well as a comparison with similar homes in the area
Home Values in the Area
Average Home Value in this Area
Purchase History
| Date | Buyer | Sale Price | Title Company |
|---|---|---|---|
| Ronald J Labree Jr Lt | -- | None Available | |
| Labree Ronald J | -- | None Available | |
| Barbara J Labree Lt | -- | -- | |
| Labree Ronald J | $110,000 | -- | |
| Cadoret Mark S | $98,000 | -- | |
| Schupp John D | $93,000 | -- |
Source: Public Records
Mortgage History
| Date | Status | Borrower | Loan Amount |
|---|---|---|---|
| Previous Owner | Schupp John D | $138,000 | |
| Previous Owner | Schupp John D | $135,000 | |
| Previous Owner | Schupp John D | $150,000 |
Source: Public Records
Tax History
| Year | Tax Paid | Tax Assessment Tax Assessment Total Assessment is a certain percentage of the fair market value that is determined by local assessors to be the total taxable value of land and additions on the property. | Land | Improvement |
|---|---|---|---|---|
| 2025 | $4,898 | $372,500 | $173,500 | $199,000 |
| 2024 | $4,597 | $372,500 | $173,500 | $199,000 |
| 2023 | $4,445 | $262,400 | $107,900 | $154,500 |
| 2022 | $4,351 | $262,400 | $107,900 | $154,500 |
| 2021 | $4,351 | $262,400 | $107,900 | $154,500 |
| 2020 | $4,648 | $222,500 | $91,700 | $130,800 |
| 2019 | $4,648 | $222,500 | $91,700 | $130,800 |
| 2018 | $4,479 | $222,500 | $91,700 | $130,800 |
| 2017 | $4,671 | $205,600 | $97,200 | $108,400 |
| 2016 | $4,501 | $205,600 | $97,200 | $108,400 |
| 2015 | $4,501 | $205,600 | $97,200 | $108,400 |
| 2014 | $4,444 | $192,700 | $84,300 | $108,400 |
Source: Public Records
Map
Nearby Homes
Your Personal Tour Guide
Ask me questions while you tour the home.