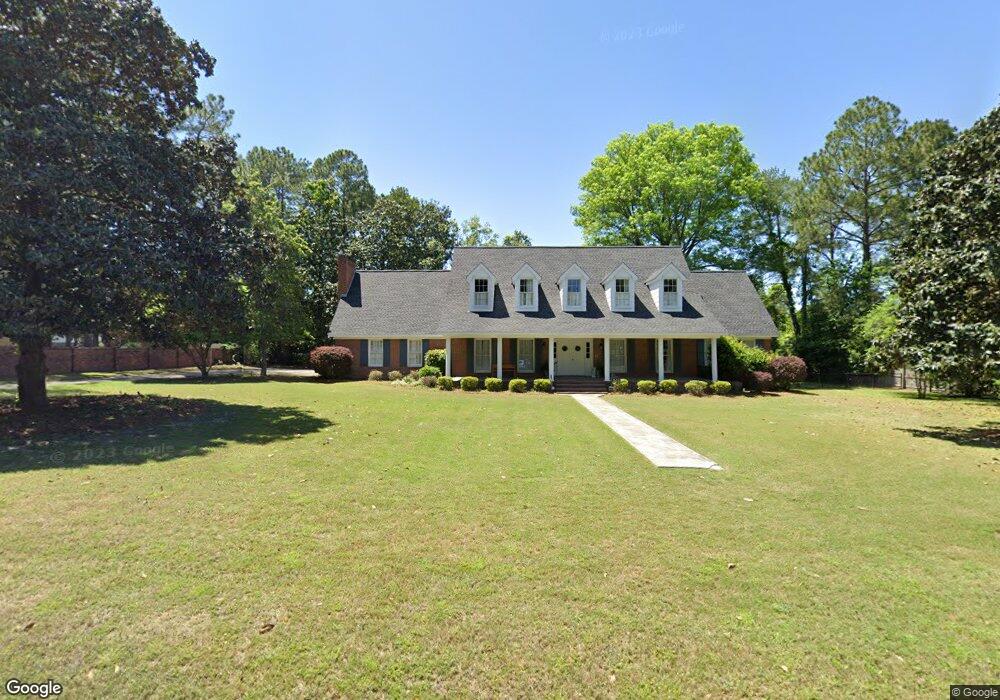
205 Plantation Dr Waycross, GA 31501
Estimated Value: $351,000 - $407,220
4
Beds
5
Baths
3,721
Sq Ft
$102/Sq Ft
Est. Value
About This Home
This home is located at 205 Plantation Dr, Waycross, GA 31501 and is currently estimated at $380,555, approximately $102 per square foot. 205 Plantation Dr is a home located in Ware County with nearby schools including Williams Heights Elementary School, Waycross Middle School, and Ware County High School.
Ownership History
Date
Name
Owned For
Owner Type
Purchase Details
Closed on
Jan 27, 2022
Sold by
Smith Zachary E
Bought by
Durden Judson Evan and Durden Carly Christina
Current Estimated Value
Home Financials for this Owner
Home Financials are based on the most recent Mortgage that was taken out on this home.
Original Mortgage
$272,964
Outstanding Balance
$253,498
Interest Rate
3.56%
Mortgage Type
FHA
Estimated Equity
$127,057
Purchase Details
Closed on
Feb 4, 2019
Sold by
Smith Harold E
Bought by
Smith Zachary E and Smith Chelsie
Purchase Details
Closed on
Aug 20, 1999
Sold by
Littlefield Dan and Littlefield La
Bought by
Smith Harold and Smith Eliza
Purchase Details
Closed on
Mar 15, 1999
Sold by
Pomeroy William L
Bought by
Littlefield Dan and Littlefield La
Purchase Details
Closed on
Dec 1, 1998
Sold by
Pomeroy Anna Est
Bought by
Pomeroy William L
Create a Home Valuation Report for This Property
The Home Valuation Report is an in-depth analysis detailing your home's value as well as a comparison with similar homes in the area
Home Values in the Area
Average Home Value in this Area
Purchase History
| Date | Buyer | Sale Price | Title Company |
|---|---|---|---|
| Durden Judson Evan | $278,000 | -- | |
| Smith Zachary E | -- | -- | |
| Smith Harold | $155,000 | -- | |
| Littlefield Dan | $190,000 | -- | |
| Pomeroy William L | -- | -- |
Source: Public Records
Mortgage History
| Date | Status | Borrower | Loan Amount |
|---|---|---|---|
| Open | Durden Judson Evan | $272,964 |
Source: Public Records
Tax History Compared to Growth
Tax History
| Year | Tax Paid | Tax Assessment Tax Assessment Total Assessment is a certain percentage of the fair market value that is determined by local assessors to be the total taxable value of land and additions on the property. | Land | Improvement |
|---|---|---|---|---|
| 2024 | $3,860 | $151,860 | $10,780 | $141,080 |
| 2023 | $3,940 | $116,504 | $7,000 | $109,504 |
| 2022 | $4,643 | $116,504 | $7,000 | $109,504 |
| 2021 | $4,134 | $95,594 | $7,000 | $88,594 |
| 2020 | $4,094 | $93,939 | $7,000 | $86,939 |
| 2019 | $3,860 | $87,318 | $7,000 | $80,318 |
| 2018 | $3,822 | $85,639 | $7,000 | $78,639 |
| 2017 | $3,734 | $85,639 | $7,000 | $78,639 |
| 2016 | $3,734 | $85,639 | $7,000 | $78,639 |
| 2015 | $3,760 | $85,639 | $7,000 | $78,639 |
| 2014 | $3,756 | $85,639 | $7,000 | $78,639 |
| 2013 | -- | $100,380 | $7,000 | $93,380 |
Source: Public Records
Map
Nearby Homes
- 1312 Atlantic Ave
- 1502 Seminole Trail
- 1204 Richmond Ave
- 1504 Danora Dr
- 914 Barkley St
- 807 City Blvd
- 1002 Baltimore Ave
- 00 Seminole Trail
- 1400 E Cherokee Dr
- 1100 Euclid Ave
- 1205 Dean Dr
- 1621 Camellia Dr
- 1009 Euclid Ave
- 1100 Atlantic Ave
- 1617 Moss Creek Rd
- 1001 Coral Rd
- 907 Euclid Ave
- Lot 3 City Blvd
- 1703 Rainbow Dr
- 903 Atlantic Ave
- 1309 Andrea Dr
- 207 Plantation Dr
- 1308 Baltimore Cir
- 1307 Andrea Dr
- 1310 Baltimore Cir
- 1306 Baltimore Cir
- 204 Plantation Dr
- 0 Plantation Dr
- Lot 40 Plantation Bluffs Dr
- 1312 Baltimore Cir
- 0 Baltimore Cir
- 1310 Andrea Dr
- 1308 Andrea Dr
- 211 Plantation Dr
- 210 Plantation Dr
- 202 Plantation Dr
- 1005 Carrie Dr
- 1314 Baltimore Cir
- 1309 Baltimore Cir
- 1405 Andrea Dr