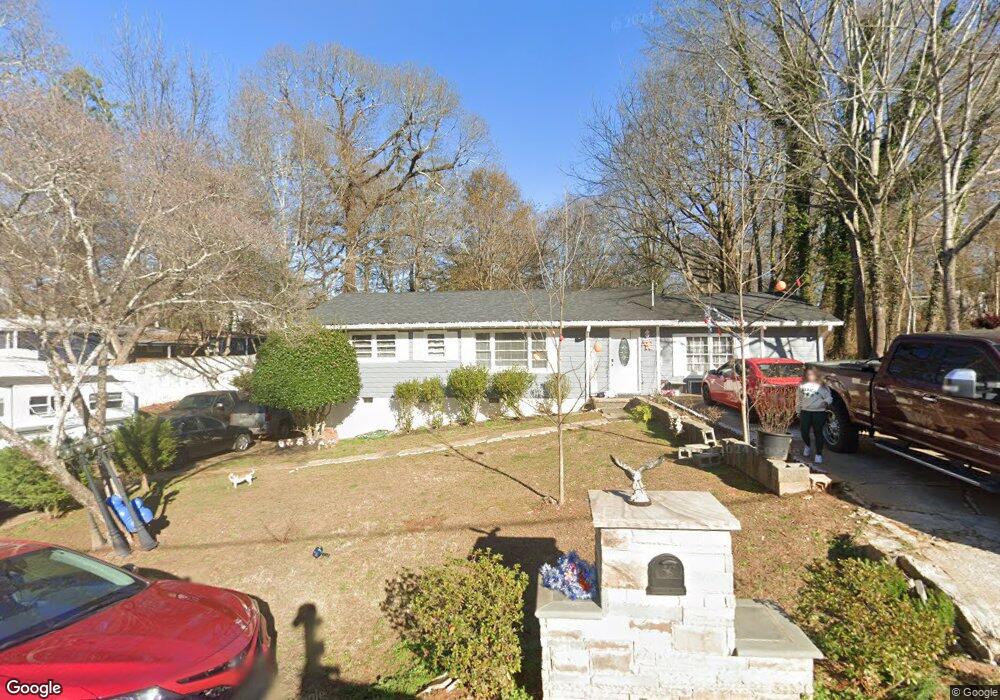
205 Pugh St Buford, GA 30518
Estimated Value: $271,000 - $358,078
3
Beds
1
Bath
1,312
Sq Ft
$233/Sq Ft
Est. Value
About This Home
This home is located at 205 Pugh St, Buford, GA 30518 and is currently estimated at $305,270, approximately $232 per square foot. 205 Pugh St is a home located in Gwinnett County with nearby schools including Buford Elementary School, Buford Senior Academy, and Buford Academy.
Ownership History
Date
Name
Owned For
Owner Type
Purchase Details
Closed on
Feb 20, 2014
Sold by
Sanchez Fernando
Bought by
Lopez Margarita
Current Estimated Value
Purchase Details
Closed on
Oct 9, 2002
Sold by
Sanchez Fernando
Bought by
Sanchez Fernando9
Home Financials for this Owner
Home Financials are based on the most recent Mortgage that was taken out on this home.
Original Mortgage
$113,106
Interest Rate
5.79%
Mortgage Type
FHA
Create a Home Valuation Report for This Property
The Home Valuation Report is an in-depth analysis detailing your home's value as well as a comparison with similar homes in the area
Home Values in the Area
Average Home Value in this Area
Purchase History
| Date | Buyer | Sale Price | Title Company |
|---|---|---|---|
| Lopez Margarita | -- | -- | |
| Sanchez Fernando9 | -- | -- | |
| Sanchez Fernando | $114,000 | -- |
Source: Public Records
Mortgage History
| Date | Status | Borrower | Loan Amount |
|---|---|---|---|
| Previous Owner | Sanchez Fernando | $113,106 |
Source: Public Records
Tax History Compared to Growth
Tax History
| Year | Tax Paid | Tax Assessment Tax Assessment Total Assessment is a certain percentage of the fair market value that is determined by local assessors to be the total taxable value of land and additions on the property. | Land | Improvement |
|---|---|---|---|---|
| 2025 | $1,748 | $121,840 | $40,000 | $81,840 |
| 2024 | $1,729 | $120,480 | $33,600 | $86,880 |
| 2023 | $1,729 | $91,120 | $26,000 | $65,120 |
| 2022 | $1,308 | $91,120 | $26,000 | $65,120 |
| 2021 | $812 | $56,600 | $16,800 | $39,800 |
| 2020 | $812 | $56,600 | $16,800 | $39,800 |
| 2019 | $733 | $56,600 | $16,800 | $39,800 |
| 2018 | $412 | $31,760 | $5,600 | $26,160 |
| 2016 | $407 | $31,760 | $5,600 | $26,160 |
| 2015 | $421 | $31,760 | $5,600 | $26,160 |
| 2014 | -- | $29,760 | $5,600 | $24,160 |
Source: Public Records
Map
Nearby Homes