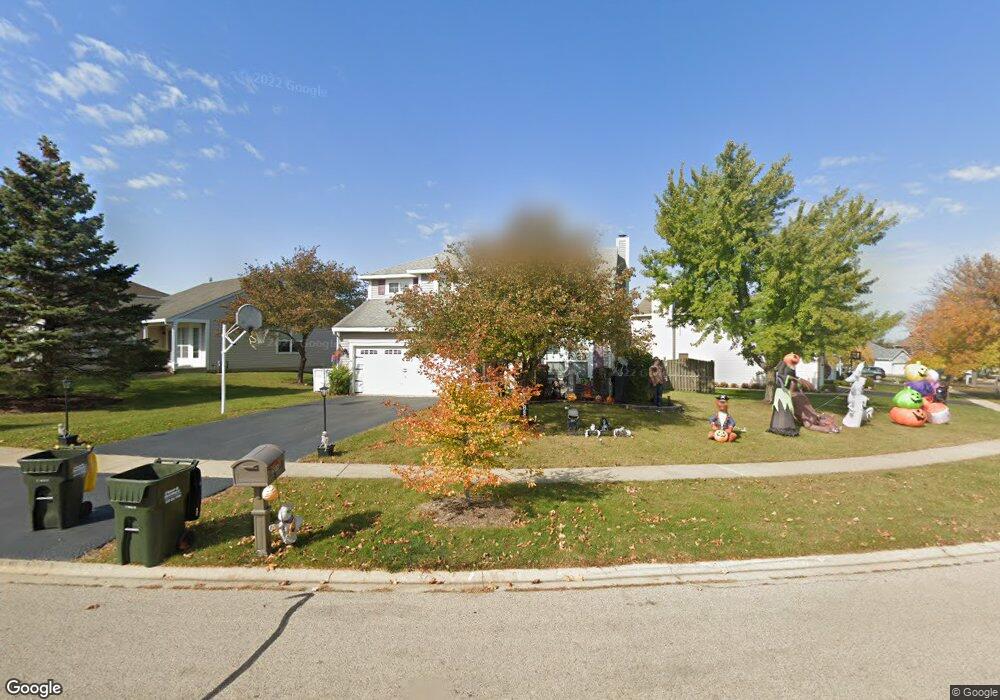
205 Rainmaker Run Lake In the Hills, IL 60156
Estimated Value: $374,821 - $422,000
4
Beds
3
Baths
1,794
Sq Ft
$222/Sq Ft
Est. Value
About This Home
This home is located at 205 Rainmaker Run, Lake In the Hills, IL 60156 and is currently estimated at $398,705, approximately $222 per square foot. 205 Rainmaker Run is a home located in McHenry County with nearby schools including Westfield Community School, Lincoln Prairie Elementary School, and Harry D Jacobs High School.
Ownership History
Date
Name
Owned For
Owner Type
Purchase Details
Closed on
Nov 16, 2001
Sold by
Fetzer Chad R
Bought by
Wayda Richard A and Wayda Kerry A
Current Estimated Value
Home Financials for this Owner
Home Financials are based on the most recent Mortgage that was taken out on this home.
Original Mortgage
$188,100
Interest Rate
5.95%
Purchase Details
Closed on
Dec 27, 1999
Sold by
Sherrill Frank P and Sherrill Jean M
Bought by
Fetzer Chad R
Home Financials for this Owner
Home Financials are based on the most recent Mortgage that was taken out on this home.
Original Mortgage
$181,560
Interest Rate
7.7%
Mortgage Type
VA
Purchase Details
Closed on
Aug 1, 1994
Sold by
Harris Bank Hinsdale
Bought by
Sherrill Frank R and Sherrill Jean M
Home Financials for this Owner
Home Financials are based on the most recent Mortgage that was taken out on this home.
Original Mortgage
$152,350
Interest Rate
7.25%
Create a Home Valuation Report for This Property
The Home Valuation Report is an in-depth analysis detailing your home's value as well as a comparison with similar homes in the area
Home Values in the Area
Average Home Value in this Area
Purchase History
| Date | Buyer | Sale Price | Title Company |
|---|---|---|---|
| Wayda Richard A | $198,000 | Multiple | |
| Fetzer Chad R | $178,000 | Universal Title Services Inc | |
| Sherrill Frank R | $160,500 | -- |
Source: Public Records
Mortgage History
| Date | Status | Borrower | Loan Amount |
|---|---|---|---|
| Previous Owner | Wayda Richard A | $188,100 | |
| Previous Owner | Fetzer Chad R | $181,560 | |
| Previous Owner | Sherrill Frank R | $152,350 |
Source: Public Records
Tax History Compared to Growth
Tax History
| Year | Tax Paid | Tax Assessment Tax Assessment Total Assessment is a certain percentage of the fair market value that is determined by local assessors to be the total taxable value of land and additions on the property. | Land | Improvement |
|---|---|---|---|---|
| 2024 | $8,491 | $114,010 | $23,532 | $90,478 |
| 2023 | $8,080 | $101,967 | $21,046 | $80,921 |
| 2022 | $7,760 | $93,464 | $24,395 | $69,069 |
| 2021 | $7,462 | $87,073 | $22,727 | $64,346 |
| 2020 | $7,278 | $83,990 | $21,922 | $62,068 |
| 2019 | $7,130 | $80,389 | $20,982 | $59,407 |
| 2018 | $6,839 | $74,480 | $19,383 | $55,097 |
| 2017 | $6,701 | $70,165 | $18,260 | $51,905 |
| 2016 | $6,597 | $65,808 | $17,126 | $48,682 |
| 2013 | -- | $63,217 | $15,976 | $47,241 |
Source: Public Records
Map
Nearby Homes
- 206 Cool Stone Bend
- 202 Cool Stone Bend
- 432 Thunder Ridge
- 1 Clara Ct Unit 4
- 201 Northlight Passe
- 212 Village Creek Dr
- 1171 Heartland Gate
- 4 Greenbrier Ct
- 15 W Oak St Unit 5
- 2 Twelve Lakes Ct
- 2801 Waterfront Ave
- 7 Shoal Creek Ct
- 109 Oakleaf Rd
- 101 Oakleaf Rd
- 16 Springbrook Ln
- 187 Hilltop Dr
- 275 Indian Trail
- 1823 Somerfield Ln
- 1207 Crystal Lake Rd
- 6 Sherwood Ct
- 207 Rainmaker Run
- 203 Rainmaker Run
- 209 Rainmaker Run
- 172 Cool Stone Bend
- 201 Rainmaker Run
- 214 Rainmaker Run
- 216 Rainmaker Run
- 170 Cool Stone Bend
- 212 Rainmaker Run
- 204 Rainmaker Run
- 211 Rainmaker Run
- 206 Rainmaker Run
- 218 Rainmaker Run
- 202 Rainmaker Run
- 168 Cool Stone Bend
- 220 Rainmaker Run
- 208 Rainmaker Run
- 210 Rainmaker Run Unit 3A
- 200 Rainmaker Run
- 213 Rainmaker Run