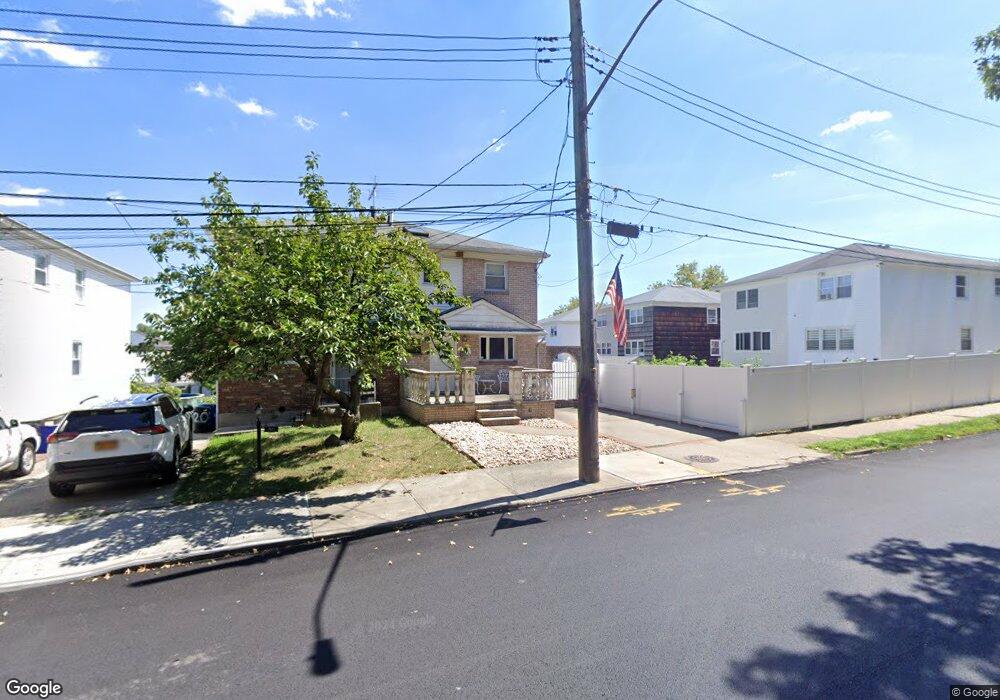
205 Riedel Ave Staten Island, NY 10306
Oakwood NeighborhoodEstimated Value: $716,000 - $806,000
3
Beds
3
Baths
1,600
Sq Ft
$475/Sq Ft
Est. Value
About This Home
This home is located at 205 Riedel Ave, Staten Island, NY 10306 and is currently estimated at $760,467, approximately $475 per square foot. 205 Riedel Ave is a home located in Richmond County with nearby schools including P.S. 23 Richmondtown, Myra S. Barnes Intermediate School 24, and New Dorp High School.
Ownership History
Date
Name
Owned For
Owner Type
Purchase Details
Closed on
Nov 29, 2006
Sold by
Tortorici Augustus and Tortorici Joanne
Bought by
Didio Frank and Didio Tami
Current Estimated Value
Home Financials for this Owner
Home Financials are based on the most recent Mortgage that was taken out on this home.
Original Mortgage
$425,000
Outstanding Balance
$298,089
Interest Rate
9.7%
Mortgage Type
Balloon
Estimated Equity
$462,378
Purchase Details
Closed on
Feb 25, 2004
Sold by
Filangeri Thomas
Bought by
Tortorici Augustus and Tortorici Joanne
Purchase Details
Closed on
Apr 29, 1998
Sold by
Hagerman Robert A and Hagerman Annemarie
Bought by
Filangeri Thomas
Purchase Details
Closed on
Jun 6, 1995
Sold by
Olsen Howard and Olsen Vincenza
Bought by
Hagerman Robert A and Hagerman Annmarie
Home Financials for this Owner
Home Financials are based on the most recent Mortgage that was taken out on this home.
Original Mortgage
$139,000
Interest Rate
7.49%
Create a Home Valuation Report for This Property
The Home Valuation Report is an in-depth analysis detailing your home's value as well as a comparison with similar homes in the area
Home Values in the Area
Average Home Value in this Area
Purchase History
| Date | Buyer | Sale Price | Title Company |
|---|---|---|---|
| Didio Frank | $500,000 | Fidelity National Title Insu | |
| Tortorici Augustus | -- | -- | |
| Filangeri Thomas | $225,000 | First American Title Ins Co | |
| Hagerman Robert A | $189,000 | Lawyers Title Insurance Corp |
Source: Public Records
Mortgage History
| Date | Status | Borrower | Loan Amount |
|---|---|---|---|
| Open | Didio Frank | $425,000 | |
| Previous Owner | Hagerman Robert A | $139,000 |
Source: Public Records
Tax History Compared to Growth
Tax History
| Year | Tax Paid | Tax Assessment Tax Assessment Total Assessment is a certain percentage of the fair market value that is determined by local assessors to be the total taxable value of land and additions on the property. | Land | Improvement |
|---|---|---|---|---|
| 2025 | $5,923 | $38,520 | $7,011 | $31,509 |
| 2024 | $5,923 | $39,120 | $6,513 | $32,607 |
| 2023 | $5,650 | $27,821 | $5,798 | $22,023 |
| 2022 | $5,554 | $38,520 | $8,640 | $29,880 |
| 2021 | $5,811 | $35,160 | $8,640 | $26,520 |
| 2020 | $5,514 | $34,980 | $8,640 | $26,340 |
| 2019 | $5,141 | $33,540 | $8,640 | $24,900 |
| 2018 | $4,726 | $23,184 | $5,878 | $17,306 |
| 2017 | $4,726 | $23,184 | $8,044 | $15,140 |
| 2016 | $4,600 | $23,009 | $7,330 | $15,679 |
| 2015 | $3,930 | $21,707 | $6,512 | $15,195 |
| 2014 | $3,930 | $20,479 | $6,642 | $13,837 |
Source: Public Records
Map
Nearby Homes