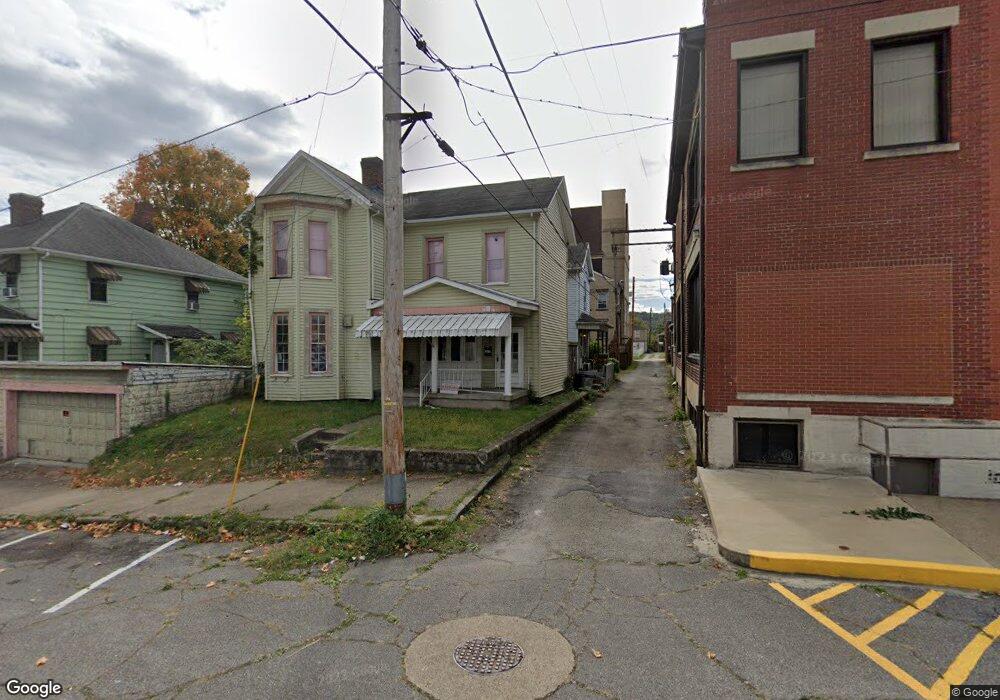
205 S 3rd St Martins Ferry, OH 43935
Estimated Value: $54,856 - $73,000
2
Beds
1
Bath
768
Sq Ft
$79/Sq Ft
Est. Value
About This Home
This home is located at 205 S 3rd St, Martins Ferry, OH 43935 and is currently estimated at $60,964, approximately $79 per square foot. 205 S 3rd St is a home located in Belmont County with nearby schools including Anna Marie Ayers Elementary School, Martins Ferry Middle School, and Martins Ferry High School.
Ownership History
Date
Name
Owned For
Owner Type
Purchase Details
Closed on
Jul 3, 2024
Sold by
Goff Brian J
Bought by
Thrash Charles J
Current Estimated Value
Purchase Details
Closed on
Jul 23, 2012
Sold by
Goff Paul
Bought by
Goff Brian J
Purchase Details
Closed on
Oct 19, 2011
Sold by
Goff Paul
Bought by
Goff Brian J
Home Financials for this Owner
Home Financials are based on the most recent Mortgage that was taken out on this home.
Original Mortgage
$14,400
Interest Rate
4.12%
Mortgage Type
Seller Take Back
Purchase Details
Closed on
Jan 1, 1986
Sold by
Walker Frederick A
Bought by
Walker Frederick A
Create a Home Valuation Report for This Property
The Home Valuation Report is an in-depth analysis detailing your home's value as well as a comparison with similar homes in the area
Home Values in the Area
Average Home Value in this Area
Purchase History
| Date | Buyer | Sale Price | Title Company |
|---|---|---|---|
| Thrash Charles J | $6,533 | None Listed On Document | |
| Thrash Charles J | $6,533 | None Listed On Document | |
| Goff Brian J | $14,400 | Attorney | |
| Goff Brian J | $14,400 | Attorney | |
| Walker Frederick A | -- | -- |
Source: Public Records
Mortgage History
| Date | Status | Borrower | Loan Amount |
|---|---|---|---|
| Previous Owner | Goff Brian J | $14,400 |
Source: Public Records
Tax History Compared to Growth
Tax History
| Year | Tax Paid | Tax Assessment Tax Assessment Total Assessment is a certain percentage of the fair market value that is determined by local assessors to be the total taxable value of land and additions on the property. | Land | Improvement |
|---|---|---|---|---|
| 2024 | $312 | $7,550 | $1,400 | $6,150 |
| 2023 | $704 | $7,320 | $1,410 | $5,910 |
| 2022 | $787 | $7,322 | $1,410 | $5,912 |
| 2021 | $1,853 | $7,322 | $1,410 | $5,912 |
| 2020 | $1,053 | $6,370 | $1,230 | $5,140 |
| 2019 | $530 | $6,370 | $1,230 | $5,140 |
| 2018 | $243 | $6,370 | $1,230 | $5,140 |
| 2017 | $146 | $2,990 | $630 | $2,360 |
| 2016 | $456 | $2,990 | $630 | $2,360 |
| 2015 | $553 | $2,990 | $630 | $2,360 |
| 2014 | $302 | $3,720 | $570 | $3,150 |
| 2013 | $175 | $3,720 | $570 | $3,150 |
Source: Public Records
Map
Nearby Homes