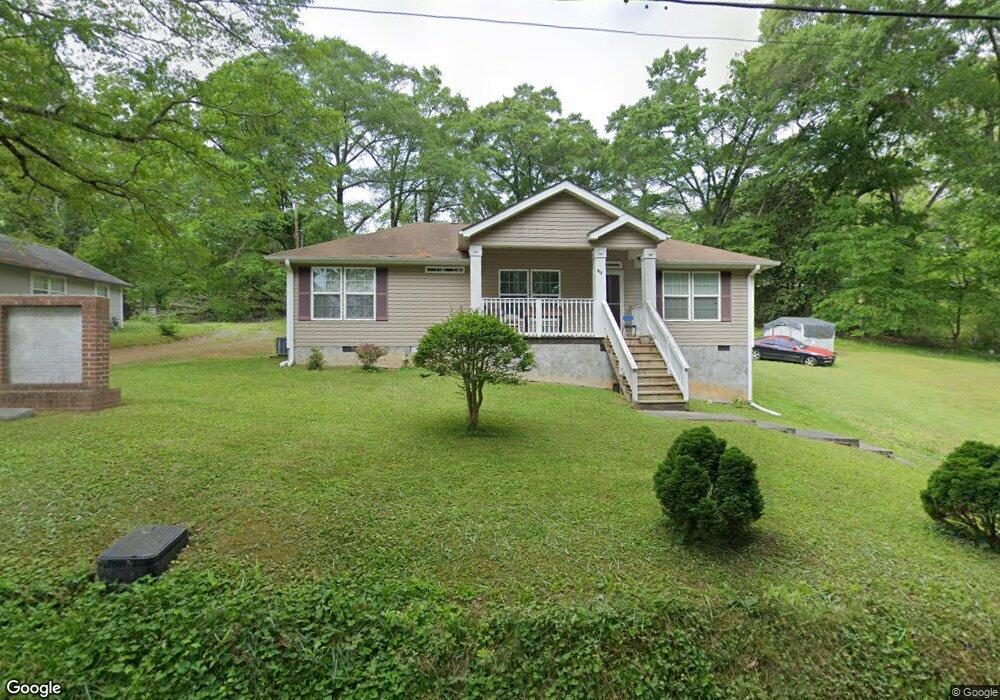
205 S High St La Fayette, GA 30728
Estimated Value: $160,000 - $204,000
--
Bed
2
Baths
1,164
Sq Ft
$155/Sq Ft
Est. Value
About This Home
This home is located at 205 S High St, La Fayette, GA 30728 and is currently estimated at $180,266, approximately $154 per square foot. 205 S High St is a home located in Walker County with nearby schools including Gilbert Elementary School, Lafayette Middle School, and Lafayette High School.
Ownership History
Date
Name
Owned For
Owner Type
Purchase Details
Closed on
May 7, 2013
Sold by
Green Tree Servicing Llc
Bought by
Wooten Betty
Current Estimated Value
Home Financials for this Owner
Home Financials are based on the most recent Mortgage that was taken out on this home.
Original Mortgage
$123,726
Outstanding Balance
$87,516
Interest Rate
3.44%
Mortgage Type
New Conventional
Estimated Equity
$92,751
Purchase Details
Closed on
Nov 12, 2004
Sold by
Southern Jr Willie
Bought by
Southern Joseph
Purchase Details
Closed on
Mar 1, 1999
Sold by
Southern Willie
Bought by
Southern Jr Willie
Purchase Details
Closed on
Jan 1, 1979
Sold by
Southern Donald W and Southern Etal
Bought by
Southern Willie
Purchase Details
Closed on
Jan 1, 1972
Sold by
North Georgia Association
Bought by
Southern Donald W and Southern Etal
Create a Home Valuation Report for This Property
The Home Valuation Report is an in-depth analysis detailing your home's value as well as a comparison with similar homes in the area
Home Values in the Area
Average Home Value in this Area
Purchase History
| Date | Buyer | Sale Price | Title Company |
|---|---|---|---|
| Wooten Betty | $57,700 | -- | |
| Southern Joseph | -- | -- | |
| Southern Jr Willie | -- | -- | |
| Southern Willie | -- | -- | |
| Southern Donald W | -- | -- | |
| North Georgia Association | -- | -- |
Source: Public Records
Mortgage History
| Date | Status | Borrower | Loan Amount |
|---|---|---|---|
| Open | Wooten Betty | $123,726 |
Source: Public Records
Tax History Compared to Growth
Tax History
| Year | Tax Paid | Tax Assessment Tax Assessment Total Assessment is a certain percentage of the fair market value that is determined by local assessors to be the total taxable value of land and additions on the property. | Land | Improvement |
|---|---|---|---|---|
| 2024 | $1,285 | $53,956 | $3,056 | $50,900 |
| 2023 | $1,255 | $51,138 | $3,056 | $48,082 |
| 2022 | $1,648 | $62,595 | $3,056 | $59,539 |
| 2021 | $1,166 | $39,714 | $3,056 | $36,658 |
| 2020 | $954 | $31,100 | $3,056 | $28,044 |
| 2019 | $955 | $31,100 | $3,056 | $28,044 |
| 2018 | $925 | $31,100 | $3,056 | $28,044 |
| 2017 | $1,034 | $31,100 | $3,056 | $28,044 |
| 2016 | $857 | $31,100 | $3,056 | $28,044 |
| 2015 | $786 | $27,170 | $2,183 | $24,987 |
| 2014 | $643 | $27,170 | $2,183 | $24,987 |
| 2013 | -- | $27,163 | $2,176 | $24,987 |
Source: Public Records
Map
Nearby Homes
- 204 S High St
- 212 S High St
- 702.5 Henderson St
- 0 Fortune St Unit 1520483
- 3 Fortune St
- 1 & 3 N High St
- 205 Cavender St
- 13 Steele St N
- 301 Cedar St
- 206 Glenn St
- 306 Cedar St
- 312 Pine St
- 307 Cavender St
- 316 Chestnut St
- 317 Cedar St
- 0 W Main St Unit 1518094
- 408 Chestnut St
- 405 Magnolia St
- 207 Culberson Ave
- 613 Bradley Ave
- 211 S High St
- 203 S High St
- 410 Walnut St
- 201 S High St
- 208 S High St
- 702 Culberson Ave
- 207 Walnut St
- 210 S High St
- 201 Walnut St
- 703 W 2nd Ave
- 206 Hickory St
- 703 Culberson Ave
- 204 Hickory St
- 208 Hickory St
- 615 N Chattanooga St
- 613 N Chattanooga St
- 705 Culberson Ave
- 0 Walnut St Unit RTC3045795
- 0 Walnut St Unit 1522902
- 0 Walnut St Unit 6124571