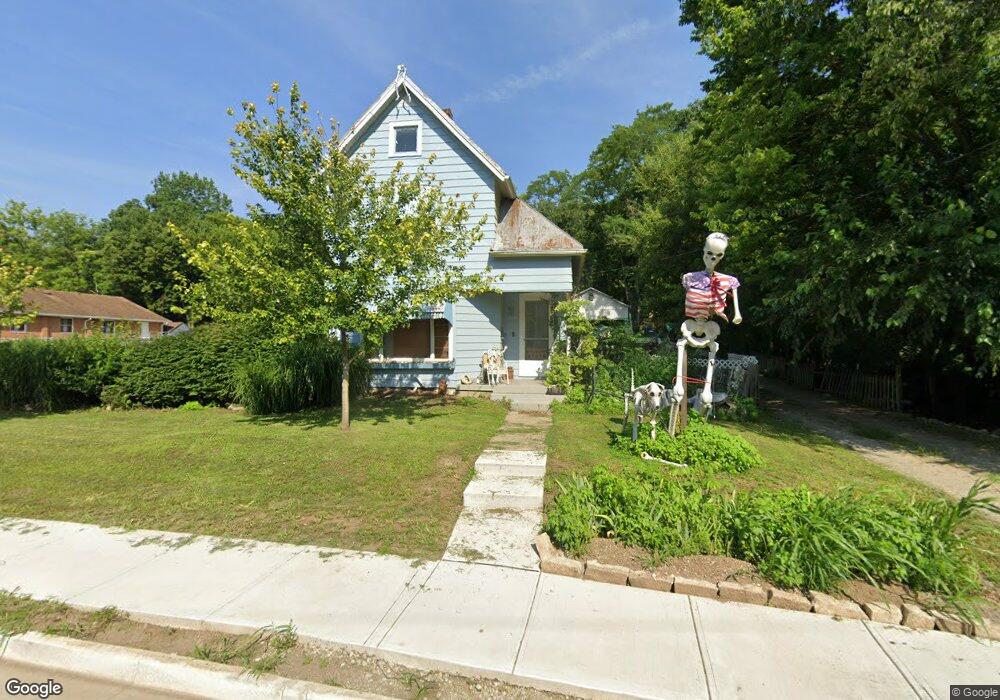
205 S Riverview Ave Miamisburg, OH 45342
Estimated Value: $179,000 - $204,000
3
Beds
1
Bath
1,488
Sq Ft
$132/Sq Ft
Est. Value
About This Home
This home is located at 205 S Riverview Ave, Miamisburg, OH 45342 and is currently estimated at $196,489, approximately $132 per square foot. 205 S Riverview Ave is a home located in Montgomery County with nearby schools including Miamisburg High School and Bethel Baptist School.
Ownership History
Date
Name
Owned For
Owner Type
Purchase Details
Closed on
Apr 25, 2007
Sold by
Sirva Relocation Llc
Bought by
Thatcher Jeffrey A and Thatcher Sheri
Current Estimated Value
Home Financials for this Owner
Home Financials are based on the most recent Mortgage that was taken out on this home.
Original Mortgage
$93,532
Outstanding Balance
$56,769
Interest Rate
6.22%
Mortgage Type
FHA
Estimated Equity
$139,720
Purchase Details
Closed on
Dec 30, 2006
Sold by
Landis Michael W
Bought by
Sirva Relocation Llc
Home Financials for this Owner
Home Financials are based on the most recent Mortgage that was taken out on this home.
Original Mortgage
$93,532
Interest Rate
6.22%
Mortgage Type
FHA
Purchase Details
Closed on
Dec 19, 2003
Sold by
Stewart Benson W and Stewart Kimberly A
Bought by
Landis Michael W
Home Financials for this Owner
Home Financials are based on the most recent Mortgage that was taken out on this home.
Original Mortgage
$104,500
Interest Rate
5.84%
Mortgage Type
Purchase Money Mortgage
Create a Home Valuation Report for This Property
The Home Valuation Report is an in-depth analysis detailing your home's value as well as a comparison with similar homes in the area
Home Values in the Area
Average Home Value in this Area
Purchase History
| Date | Buyer | Sale Price | Title Company |
|---|---|---|---|
| Thatcher Jeffrey A | $95,000 | Evans Title Agency Inc | |
| Sirva Relocation Llc | $106,000 | Evans Title Agency Inc | |
| Landis Michael W | $110,000 | -- |
Source: Public Records
Mortgage History
| Date | Status | Borrower | Loan Amount |
|---|---|---|---|
| Open | Thatcher Jeffrey A | $93,532 | |
| Previous Owner | Sirva Relocation Llc | $93,532 | |
| Previous Owner | Landis Michael W | $104,500 |
Source: Public Records
Tax History Compared to Growth
Tax History
| Year | Tax Paid | Tax Assessment Tax Assessment Total Assessment is a certain percentage of the fair market value that is determined by local assessors to be the total taxable value of land and additions on the property. | Land | Improvement |
|---|---|---|---|---|
| 2024 | $2,197 | $34,200 | $8,240 | $25,960 |
| 2023 | $2,197 | $34,200 | $8,240 | $25,960 |
| 2022 | $2,410 | $31,670 | $7,630 | $24,040 |
| 2021 | $2,134 | $31,670 | $7,630 | $24,040 |
| 2020 | $2,129 | $31,670 | $7,630 | $24,040 |
| 2019 | $2,159 | $29,470 | $7,630 | $21,840 |
| 2018 | $2,166 | $29,470 | $7,630 | $21,840 |
| 2017 | $2,151 | $29,470 | $7,630 | $21,840 |
| 2016 | $2,069 | $27,300 | $7,630 | $19,670 |
| 2015 | $2,029 | $27,300 | $7,630 | $19,670 |
| 2014 | $2,029 | $27,300 | $7,630 | $19,670 |
| 2012 | -- | $29,880 | $11,450 | $18,430 |
Source: Public Records
Map
Nearby Homes
- 265 S Riverview Ave
- 7 N Riverview Ave
- 111 Old Main St
- 111 S Main St
- 150 S Main St
- 625 W Linden Ave
- 42 S Main St
- 652 Raton Pass
- 631 Upper Miamisburg Rd
- 686 S Riverview Ave
- 513 Mound Ave
- 319 N 1st St
- 619 Jefferson St
- 235 S 7th St
- 607 E Central Ave
- 849 Johnson Ave
- 555 E Sycamore St
- 736 Park Ave
- 805 E Linden Ave
- 20 Chris Ln
- 151 S Riverview Ave
- 204 S Riverview Ave
- 210 S Riverview Ave
- 220 S Riverview Ave
- 228 S Riverview Ave
- 149 S Riverview Ave
- 234 S Riverview Ave
- 233 S Riverview Ave
- 129 S Riverview Ave
- 239 S Riverview Ave
- 125 S Riverview Ave
- 410 W Linden Ave
- 245 S Riverview Ave
- 111 S Riverview Ave
- 253 S Riverview Ave
- 105 S Riverview Ave
- 440 W Linden Ave
- 259 S Riverview Ave
- 101 S Riverview Ave
- 0 N Riverview Ave Unit 441744