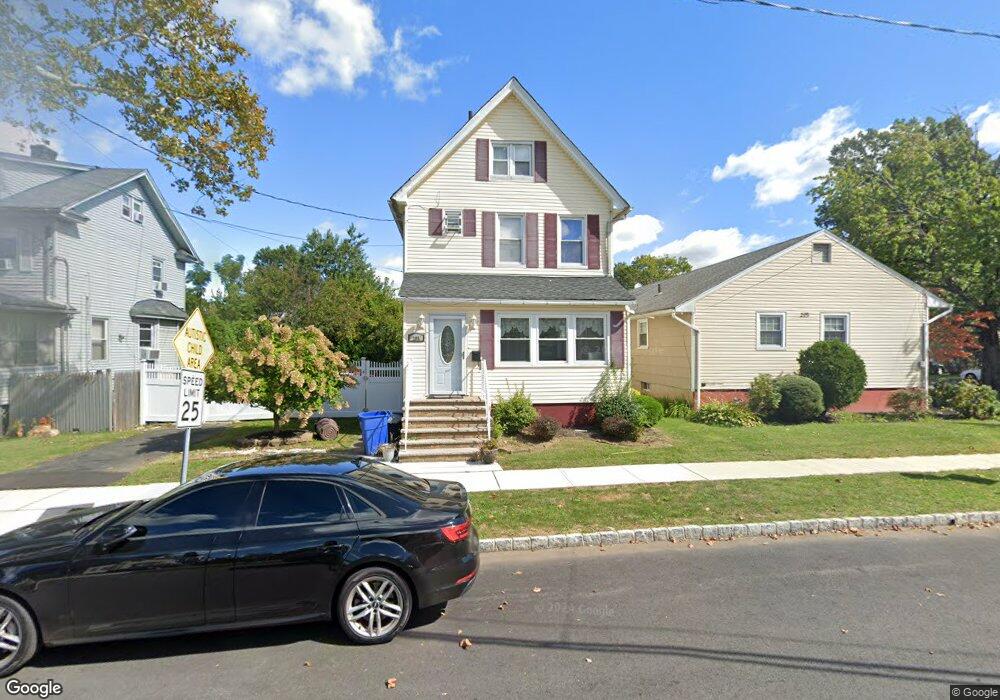
205 Sheridan Ave Roselle Park, NJ 07204
Estimated Value: $556,000 - $649,000
--
Bed
--
Bath
1,544
Sq Ft
$378/Sq Ft
Est. Value
About This Home
This home is located at 205 Sheridan Ave, Roselle Park, NJ 07204 and is currently estimated at $583,830, approximately $378 per square foot. 205 Sheridan Ave is a home located in Union County with nearby schools including Roselle Park High School, Jewish Educational Center Lower School, and St. Joseph the Carpenter School.
Ownership History
Date
Name
Owned For
Owner Type
Purchase Details
Closed on
Oct 23, 2006
Sold by
Dominicis Rafelina
Bought by
Rodriguez Moncayo Hanlly and Moncayo Louis A
Current Estimated Value
Home Financials for this Owner
Home Financials are based on the most recent Mortgage that was taken out on this home.
Original Mortgage
$300,000
Interest Rate
8%
Mortgage Type
Purchase Money Mortgage
Purchase Details
Closed on
Jul 28, 1999
Sold by
Crego Raydel E and Crego Josefa L
Bought by
Dominicis Carlos and Dominicis Rafelina
Home Financials for this Owner
Home Financials are based on the most recent Mortgage that was taken out on this home.
Original Mortgage
$109,650
Interest Rate
7.6%
Purchase Details
Closed on
Jun 27, 1996
Sold by
Baker Robert and Baker Eva I
Bought by
Crego Raydel E and Crego Josefa L
Create a Home Valuation Report for This Property
The Home Valuation Report is an in-depth analysis detailing your home's value as well as a comparison with similar homes in the area
Home Values in the Area
Average Home Value in this Area
Purchase History
| Date | Buyer | Sale Price | Title Company |
|---|---|---|---|
| Rodriguez Moncayo Hanlly | $375,000 | Lawyers Title Insurance Corp | |
| Dominicis Carlos | $129,000 | -- | |
| Crego Raydel E | $108,500 | -- |
Source: Public Records
Mortgage History
| Date | Status | Borrower | Loan Amount |
|---|---|---|---|
| Previous Owner | Rodriguez Moncayo Hanlly | $300,000 | |
| Previous Owner | Dominicis Carlos | $109,650 |
Source: Public Records
Tax History Compared to Growth
Tax History
| Year | Tax Paid | Tax Assessment Tax Assessment Total Assessment is a certain percentage of the fair market value that is determined by local assessors to be the total taxable value of land and additions on the property. | Land | Improvement |
|---|---|---|---|---|
| 2025 | $11,950 | $270,300 | $125,000 | $145,300 |
| 2024 | $11,655 | $270,300 | $125,000 | $145,300 |
| 2023 | $11,655 | $270,300 | $125,000 | $145,300 |
| 2022 | $11,199 | $270,300 | $125,000 | $145,300 |
| 2021 | $11,120 | $270,300 | $125,000 | $145,300 |
| 2020 | $11,044 | $270,300 | $125,000 | $145,300 |
| 2019 | $12,534 | $310,700 | $125,000 | $185,700 |
| 2018 | $12,363 | $310,700 | $125,000 | $185,700 |
| 2017 | $12,223 | $310,700 | $125,000 | $185,700 |
| 2016 | $11,841 | $310,700 | $125,000 | $185,700 |
| 2015 | $8,370 | $61,600 | $25,000 | $36,600 |
| 2014 | $7,951 | $61,600 | $25,000 | $36,600 |
Source: Public Records
Map
Nearby Homes
- 220 Sherman Ave
- 214 Sherman Ave
- 105 Pershing Ave
- 219 Magie Ave
- 362 E Clay Ave
- 111 Avon St
- 1041 3 Gallopinghill Rd
- 255 E Westfield Ave
- 315 Hemlock St
- 504 E Lincoln Ave
- 107 Chandler Ave
- 302 E Lincoln Ave
- 164 E Clay Ave
- 173 E Webster Ave
- 212 Thompson Ave
- 201 E Lincoln Ave
- 45 Summit Rd Unit 47
- 549 E 3rd Ave
- 619 Spruce St
- 13-15 Hillside Rd
- 209 Sheridan Ave
- 203 Sheridan Ave
- 215 Sheridan Ave
- 204 Bender Ave
- 208 Bender Ave
- 200 Bender Ave
- 217 Sheridan Ave
- 212 Bender Ave
- 155 Sheridan Ave
- 204 Sheridan Ave
- 208 Sheridan Ave
- 200 Sheridan Ave
- 210 Sheridan Ave
- 221 Sheridan Ave
- 216 Bender Ave
- 153 Sheridan Ave
- 214 Sheridan Ave
- 134 Bender Ave
- 223 Sheridan Ave
- 218 Sheridan Ave