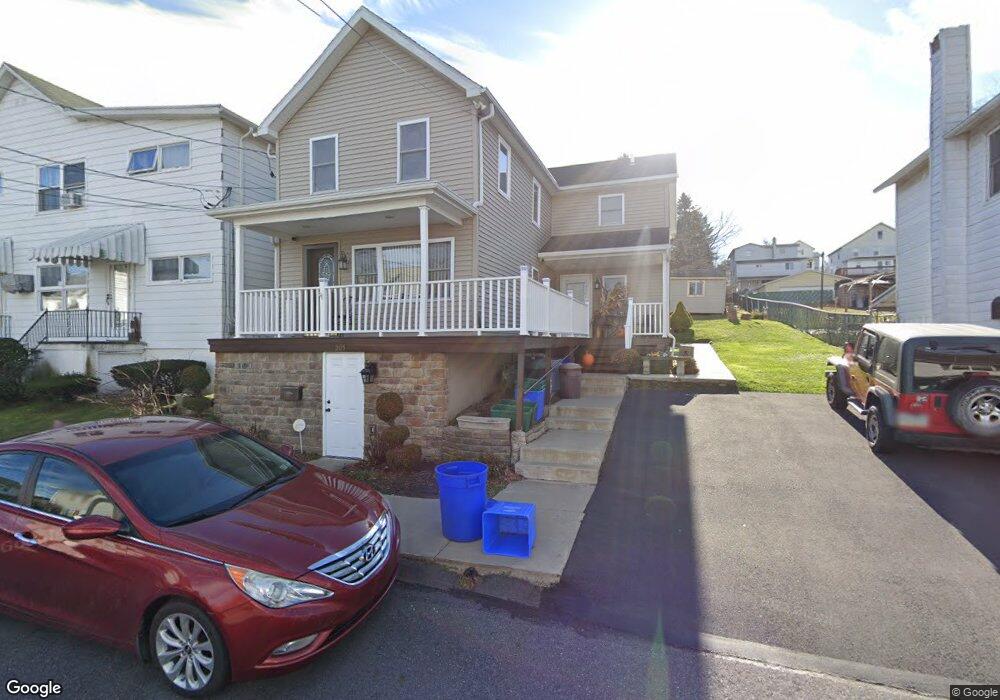
205 Smith St Dupont, PA 18641
Estimated Value: $135,387 - $283,000
--
Bed
--
Bath
1,832
Sq Ft
$107/Sq Ft
Est. Value
About This Home
This home is located at 205 Smith St, Dupont, PA 18641 and is currently estimated at $196,097, approximately $107 per square foot. 205 Smith St is a home located in Luzerne County with nearby schools including Pittston City Intermediate Center, Pittston Area Middle School, and Frederick County Middle School.
Ownership History
Date
Name
Owned For
Owner Type
Purchase Details
Closed on
Mar 12, 2015
Sold by
Syms Roger Andrew
Bought by
Syms Roger A and Syms Denise A
Current Estimated Value
Home Financials for this Owner
Home Financials are based on the most recent Mortgage that was taken out on this home.
Original Mortgage
$102,500
Interest Rate
3.67%
Mortgage Type
New Conventional
Purchase Details
Closed on
Apr 11, 2008
Sold by
Proietto Grace B
Bought by
Syms Roger Andrew
Create a Home Valuation Report for This Property
The Home Valuation Report is an in-depth analysis detailing your home's value as well as a comparison with similar homes in the area
Home Values in the Area
Average Home Value in this Area
Purchase History
| Date | Buyer | Sale Price | Title Company |
|---|---|---|---|
| Syms Roger A | -- | None Available | |
| Syms Roger Andrew | -- | None Available |
Source: Public Records
Mortgage History
| Date | Status | Borrower | Loan Amount |
|---|---|---|---|
| Closed | Syms Roger A | $102,500 |
Source: Public Records
Tax History Compared to Growth
Tax History
| Year | Tax Paid | Tax Assessment Tax Assessment Total Assessment is a certain percentage of the fair market value that is determined by local assessors to be the total taxable value of land and additions on the property. | Land | Improvement |
|---|---|---|---|---|
| 2025 | $1,588 | $64,500 | $21,200 | $43,300 |
| 2024 | $1,588 | $64,500 | $21,200 | $43,300 |
| 2023 | $1,588 | $64,500 | $21,200 | $43,300 |
| 2022 | $1,576 | $64,500 | $21,200 | $43,300 |
| 2021 | $1,576 | $64,500 | $21,200 | $43,300 |
| 2020 | $1,540 | $64,500 | $21,200 | $43,300 |
| 2019 | $1,528 | $64,500 | $21,200 | $43,300 |
| 2018 | $1,496 | $64,500 | $21,200 | $43,300 |
| 2017 | $1,430 | $64,500 | $21,200 | $43,300 |
| 2016 | -- | $64,500 | $21,200 | $43,300 |
| 2015 | -- | $64,500 | $21,200 | $43,300 |
| 2014 | -- | $64,500 | $21,200 | $43,300 |
Source: Public Records
Map
Nearby Homes