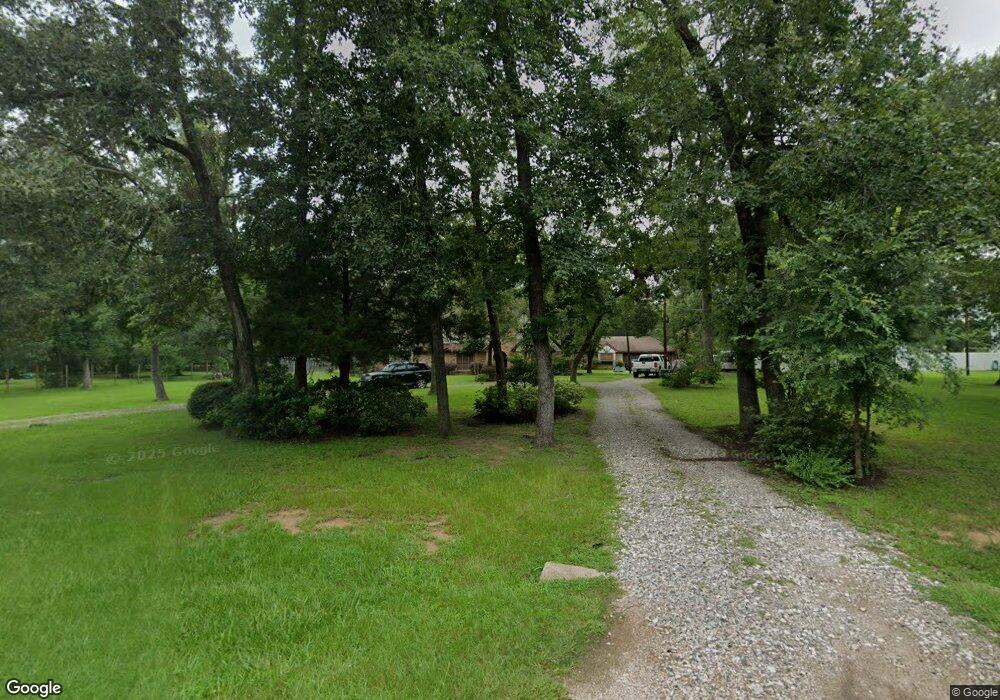
205 Tall Pines Dr Magnolia, TX 77354
Estimated Value: $552,118 - $732,000
--
Bed
3
Baths
3,184
Sq Ft
$196/Sq Ft
Est. Value
About This Home
This home is located at 205 Tall Pines Dr, Magnolia, TX 77354 and is currently estimated at $624,530, approximately $196 per square foot. 205 Tall Pines Dr is a home located in Montgomery County with nearby schools including Decker Prairie Elementary School, Tomball Intermediate School, and Tomball Junior High School.
Ownership History
Date
Name
Owned For
Owner Type
Purchase Details
Closed on
Feb 26, 1999
Sold by
Schmitzer James L and Schmitzer Carolyn R
Bought by
Shalloup Julie D and Shalloup Troy L
Current Estimated Value
Home Financials for this Owner
Home Financials are based on the most recent Mortgage that was taken out on this home.
Original Mortgage
$126,000
Interest Rate
7.85%
Purchase Details
Closed on
Dec 31, 1993
Sold by
Bates Walter E and Bates Dawn
Bought by
Shalloup Troy L and Shalloup Julie D
Home Financials for this Owner
Home Financials are based on the most recent Mortgage that was taken out on this home.
Original Mortgage
$132,050
Interest Rate
7.29%
Purchase Details
Closed on
Aug 1, 1989
Bought by
Shalloup Troy L and Shalloup Julie D
Create a Home Valuation Report for This Property
The Home Valuation Report is an in-depth analysis detailing your home's value as well as a comparison with similar homes in the area
Home Values in the Area
Average Home Value in this Area
Purchase History
| Date | Buyer | Sale Price | Title Company |
|---|---|---|---|
| Shalloup Julie D | -- | Chicago Title | |
| Shalloup Troy L | -- | -- | |
| Schmitzer James L | -- | Title Agency #50 | |
| Shalloup Troy L | -- | -- |
Source: Public Records
Mortgage History
| Date | Status | Borrower | Loan Amount |
|---|---|---|---|
| Previous Owner | Shalloup Julie D | $126,000 | |
| Previous Owner | Schmitzer James L | $132,050 |
Source: Public Records
Tax History Compared to Growth
Tax History
| Year | Tax Paid | Tax Assessment Tax Assessment Total Assessment is a certain percentage of the fair market value that is determined by local assessors to be the total taxable value of land and additions on the property. | Land | Improvement |
|---|---|---|---|---|
| 2025 | $4,299 | $370,429 | -- | -- |
| 2024 | $3,795 | $336,754 | -- | -- |
| 2023 | $3,795 | $306,140 | $112,500 | $244,570 |
| 2022 | $5,142 | $278,310 | $93,750 | $227,260 |
| 2021 | $4,862 | $253,010 | $25,000 | $228,010 |
| 2020 | $5,200 | $259,480 | $25,000 | $234,480 |
| 2019 | $4,775 | $241,850 | $25,000 | $216,850 |
| 2018 | $5,738 | $276,600 | $25,000 | $251,600 |
| 2017 | $5,392 | $259,100 | $7,500 | $251,600 |
| 2016 | $5,263 | $252,920 | $7,500 | $245,420 |
| 2015 | $5,412 | $280,830 | $7,500 | $273,330 |
| 2014 | $5,412 | $255,850 | $7,500 | $248,350 |
Source: Public Records
Map
Nearby Homes
- 26422 Hardin Store Rd
- 26320 Pin Oak Dr
- TRACT 6B1-2 Mury Bartley
- 000 Hardin Store Rd
- 26032 Hardin Store Rd
- 26028 Hardin Store Rd
- 26050 Andy Ln
- 10288 Badger Run Ln
- 1223 Virgie Community Rd
- 10260 Badger Run Ln
- 27314 Axis Deer Trail
- 27310 Axis Deer Trail
- 27286 Axis Deer Trail
- 26527 Bayou Tesch Dr
- 27278 Axis Deer Trail
- 27274 Axis Deer Trail
- 27011 Azalea Ct
- 27318 Axis Deer Trail
- 10236 Badger Run Ln
- 10216 Longhorn Ridge Ct
- 207 Tall Pines Dr
- 103 Pin Oak Ln
- 210 Tall Pines Dr
- 340 Pin Oak
- 202 Tall Pines Dr
- 211 Tall Pines Dr
- 26514 Hardin Store Rd
- 311 Tall Pines Dr
- 303 Tall Pines Dr
- 2.71Ac Tall Pines Dr
- 2.96Ac Tall Pines Dr
- 903 Tall Pines Dr
- 26402 Hardin Store Rd
- 915 Tall Pines Dr
- 222 Tall Pines Dr
- 26526 Hardin Store Rd
- 219 Tall Pines Dr
- 00 Hardin Store Rd
- 817 Tall Pines Dr
- 202 Pin Oak Ln