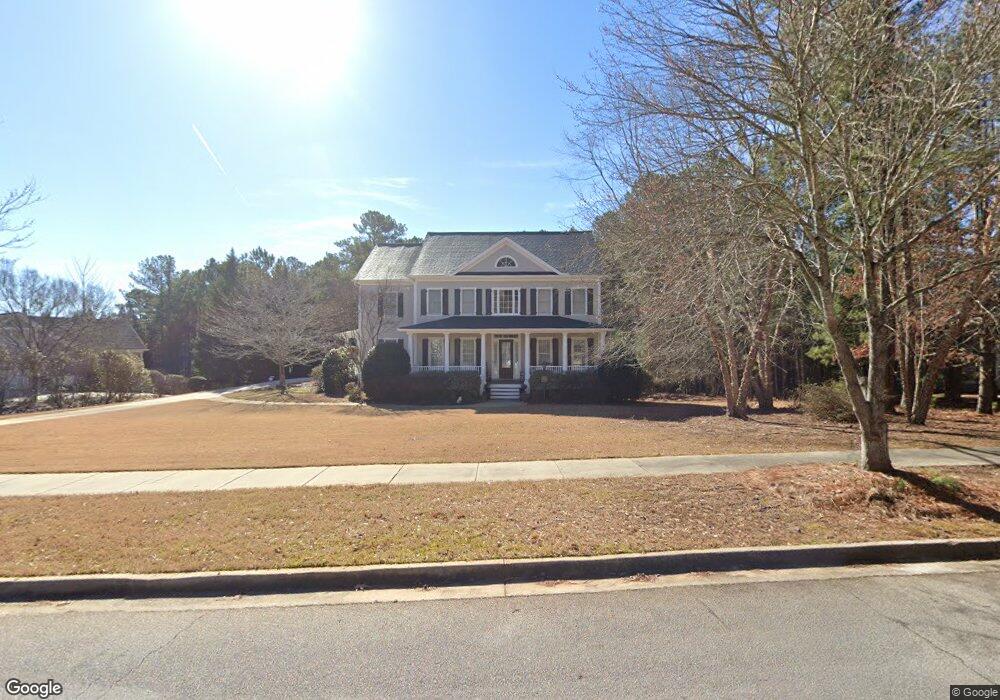
205 Tarragon Dr Fayetteville, GA 30215
Whitewater NeighborhoodEstimated Value: $1,197,225 - $1,360,000
--
Bed
--
Bath
4,404
Sq Ft
$292/Sq Ft
Est. Value
About This Home
This home is located at 205 Tarragon Dr, Fayetteville, GA 30215 and is currently estimated at $1,284,806, approximately $291 per square foot. 205 Tarragon Dr is a home located in Fayette County with nearby schools including Braelinn Elementary School, Rising Starr Middle School, and Starrs Mill High School.
Ownership History
Date
Name
Owned For
Owner Type
Purchase Details
Closed on
Aug 5, 2021
Sold by
Vincent Paul
Bought by
Hammond Dominique and Hammond Claire Lorraine
Current Estimated Value
Purchase Details
Closed on
Dec 12, 2018
Sold by
Vincent Paul C
Bought by
Vincent Paul C and Hammond Dominique Vincent
Purchase Details
Closed on
May 20, 2009
Sold by
Southern Communities Dev Llc
Bought by
Vincent Paul and Vincent Marie
Purchase Details
Closed on
Apr 10, 2006
Sold by
Vincent Paul C and Vincent Marie M
Bought by
Vincent Trust
Purchase Details
Closed on
Jan 10, 2005
Sold by
Cooke Robert J and Cooke Kerri
Bought by
Vincent Paul C and Vincent Marie
Purchase Details
Closed on
Nov 8, 2002
Sold by
Kenny Johnson Homes
Bought by
Cooke Robert J and Cooke Kerri L
Home Financials for this Owner
Home Financials are based on the most recent Mortgage that was taken out on this home.
Original Mortgage
$400,000
Interest Rate
5.5%
Mortgage Type
New Conventional
Create a Home Valuation Report for This Property
The Home Valuation Report is an in-depth analysis detailing your home's value as well as a comparison with similar homes in the area
Home Values in the Area
Average Home Value in this Area
Purchase History
| Date | Buyer | Sale Price | Title Company |
|---|---|---|---|
| Hammond Dominique | -- | -- | |
| Vincent Paul C | -- | -- | |
| Vincent Paul | $150,000 | -- | |
| Vincent Paul | $150,000 | -- | |
| Vincent Trust | -- | -- | |
| Vincent Paul C | $627,400 | -- | |
| Cooke Robert J | $550,000 | -- |
Source: Public Records
Mortgage History
| Date | Status | Borrower | Loan Amount |
|---|---|---|---|
| Previous Owner | Cooke Robert J | $400,000 |
Source: Public Records
Tax History Compared to Growth
Tax History
| Year | Tax Paid | Tax Assessment Tax Assessment Total Assessment is a certain percentage of the fair market value that is determined by local assessors to be the total taxable value of land and additions on the property. | Land | Improvement |
|---|---|---|---|---|
| 2024 | $10,743 | $431,296 | $65,200 | $366,096 |
| 2023 | $9,964 | $376,440 | $65,200 | $311,240 |
| 2022 | $9,168 | $330,000 | $65,200 | $264,800 |
| 2021 | $5,825 | $350,180 | $47,500 | $302,680 |
| 2020 | $5,954 | $326,060 | $47,500 | $278,560 |
| 2019 | $5,854 | $316,940 | $47,500 | $269,440 |
| 2018 | $5,729 | $307,380 | $47,500 | $259,880 |
| 2017 | $5,779 | $308,140 | $47,500 | $260,640 |
| 2016 | $5,663 | $293,660 | $47,500 | $246,160 |
| 2015 | $5,293 | $269,140 | $47,500 | $221,640 |
| 2014 | $4,813 | $239,100 | $47,500 | $191,600 |
| 2013 | -- | $239,100 | $0 | $0 |
Source: Public Records
Map
Nearby Homes
- 119 Quarters Rd
- 195 Trotters Ridge
- 125 County Down
- 150 Coventry Ct
- 940 Winged Foot Trail
- 160 Green Meadow Ln
- 100 Brisbane Ct
- 770 Tralee Dr
- 135 Troon Dr
- 120 Kapalua Point
- 180 Browns Crossing Dr
- 335 Birkdale Dr
- 205 Newhaven Dr
- 115 Tall Timber Ct
- 165 Isleworth Way
- 450 Birkdale Dr
- 110 Turnberry Cir
- LOT 12 Meadowlark Dr
- 183 Busbin Rd
- 5+/- AC Busbin Rd
- 225 Tarragon Dr
- 185 Tarragon Dr
- 235 Tarragon Dr
- 190 Tarragon Dr
- 165 Tarragon Dr
- 180 Tarragon Dr
- 210 Tarragon Dr
- 200 Tarragon Dr
- 105 Highgrove Dr Unit 234
- 105 Highgrove Dr
- 245 Tarragon Dr
- 170 Tarragon Dr
- 145 Tarragon Dr Unit 7
- 230 Tarragon Dr
- 115 Highgrove Dr Unit 233
- 115 Highgrove Dr
- 160 Tarragon Dr
- 255 Tarragon Dr
- 240 Tarragon Dr
- 240 Tarragon Dr Unit 236