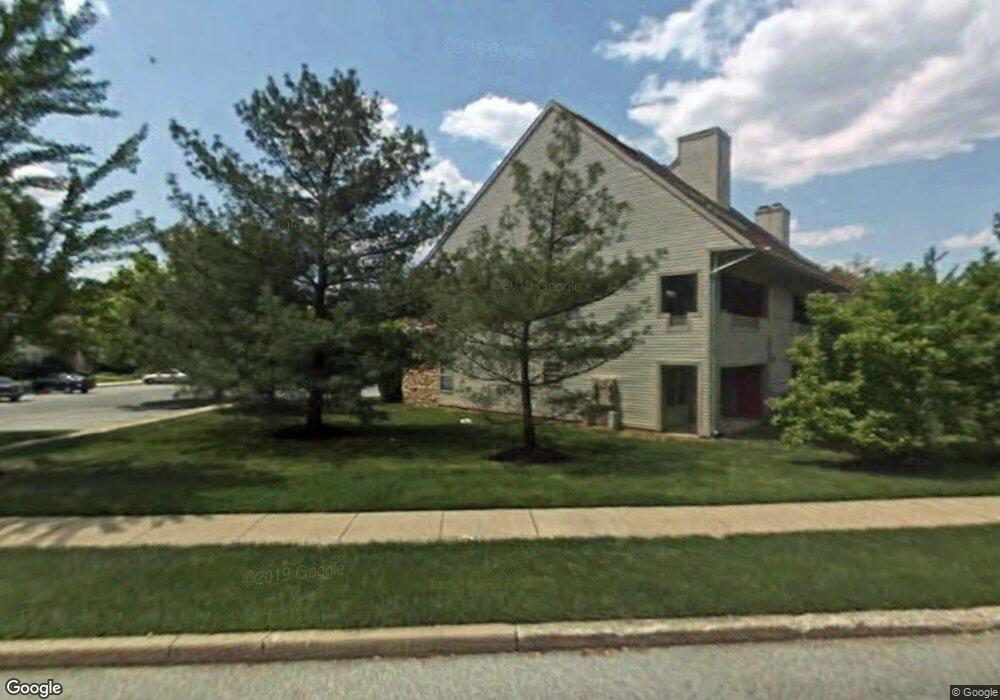
205 Tavistock Cherry Hill, NJ 08034
Estimated Value: $309,000 - $322,000
--
Bed
--
Bath
1,101
Sq Ft
$289/Sq Ft
Est. Value
About This Home
This home is located at 205 Tavistock, Cherry Hill, NJ 08034 and is currently estimated at $317,657, approximately $288 per square foot. 205 Tavistock is a home located in Camden County with nearby schools including A. Russell Knight Elementary School, John A Carusi Middle School, and Cherry Hill High-West High School.
Ownership History
Date
Name
Owned For
Owner Type
Purchase Details
Closed on
Nov 15, 2001
Sold by
Golin Gregg
Bought by
Hiltner Robert L and Hiltner Linda Bond
Current Estimated Value
Home Financials for this Owner
Home Financials are based on the most recent Mortgage that was taken out on this home.
Original Mortgage
$90,300
Outstanding Balance
$34,981
Interest Rate
6.6%
Estimated Equity
$282,676
Purchase Details
Closed on
Jun 28, 1996
Sold by
Mccloskey Kara
Bought by
Golin Gregg
Home Financials for this Owner
Home Financials are based on the most recent Mortgage that was taken out on this home.
Original Mortgage
$80,000
Interest Rate
8.37%
Mortgage Type
FHA
Create a Home Valuation Report for This Property
The Home Valuation Report is an in-depth analysis detailing your home's value as well as a comparison with similar homes in the area
Home Values in the Area
Average Home Value in this Area
Purchase History
| Date | Buyer | Sale Price | Title Company |
|---|---|---|---|
| Hiltner Robert L | $112,900 | -- | |
| Golin Gregg | $81,500 | -- |
Source: Public Records
Mortgage History
| Date | Status | Borrower | Loan Amount |
|---|---|---|---|
| Open | Hiltner Robert L | $90,300 | |
| Previous Owner | Golin Gregg | $80,000 |
Source: Public Records
Tax History Compared to Growth
Tax History
| Year | Tax Paid | Tax Assessment Tax Assessment Total Assessment is a certain percentage of the fair market value that is determined by local assessors to be the total taxable value of land and additions on the property. | Land | Improvement |
|---|---|---|---|---|
| 2025 | $5,823 | $130,600 | $30,000 | $100,600 |
| 2024 | $5,488 | $130,600 | $30,000 | $100,600 |
| 2023 | $5,488 | $130,600 | $30,000 | $100,600 |
| 2022 | $5,336 | $130,600 | $30,000 | $100,600 |
| 2021 | $5,353 | $130,600 | $30,000 | $100,600 |
| 2020 | $5,288 | $130,600 | $30,000 | $100,600 |
| 2019 | $5,285 | $130,600 | $30,000 | $100,600 |
| 2018 | $5,271 | $130,600 | $30,000 | $100,600 |
| 2017 | $5,199 | $130,600 | $30,000 | $100,600 |
| 2016 | $5,130 | $130,600 | $30,000 | $100,600 |
| 2015 | $5,049 | $130,600 | $30,000 | $100,600 |
| 2014 | $4,993 | $130,600 | $30,000 | $100,600 |
Source: Public Records
Map
Nearby Homes