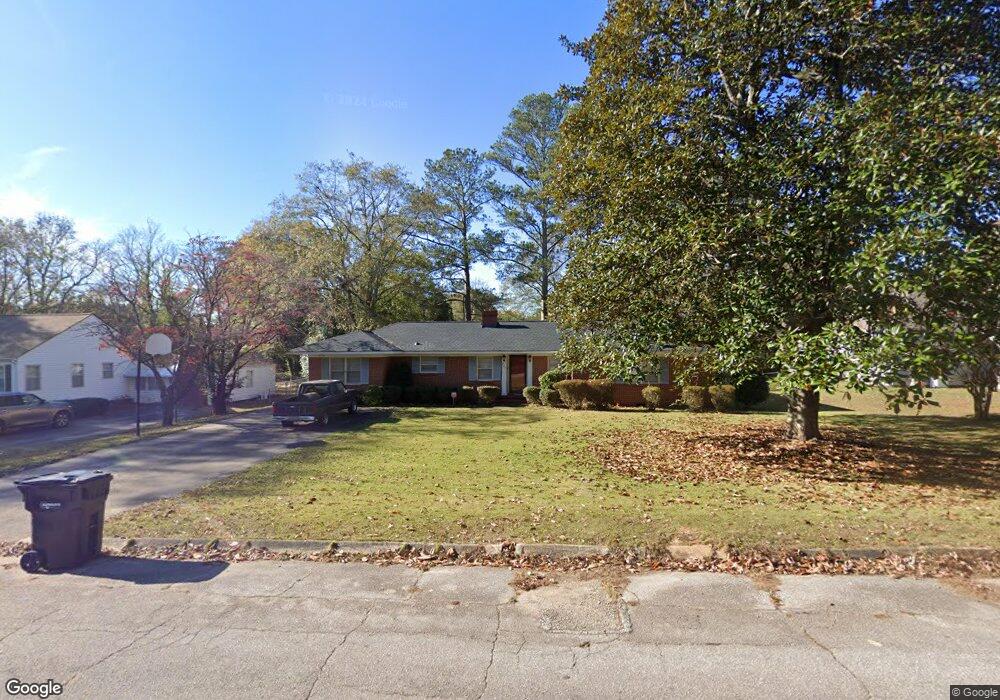
205 Teel Rd West Point, GA 31833
Estimated Value: $202,000 - $242,000
3
Beds
2
Baths
1,753
Sq Ft
$125/Sq Ft
Est. Value
About This Home
This home is located at 205 Teel Rd, West Point, GA 31833 and is currently estimated at $219,001, approximately $124 per square foot. 205 Teel Rd is a home located in Harris County with nearby schools including New Mountain Hill Elementary School, Harris County Carver Middle School, and Harris County High School.
Ownership History
Date
Name
Owned For
Owner Type
Purchase Details
Closed on
Oct 27, 2020
Sold by
Cdr Ventures Llc
Bought by
Colvin Anshun
Current Estimated Value
Home Financials for this Owner
Home Financials are based on the most recent Mortgage that was taken out on this home.
Original Mortgage
$156,120
Outstanding Balance
$137,970
Interest Rate
2.8%
Mortgage Type
FHA
Estimated Equity
$81,031
Purchase Details
Closed on
Oct 18, 2017
Sold by
Reeves Coleman D
Bought by
Cdr Ventures Llc
Home Financials for this Owner
Home Financials are based on the most recent Mortgage that was taken out on this home.
Original Mortgage
$170,000
Interest Rate
3.83%
Mortgage Type
Purchase Money Mortgage
Purchase Details
Closed on
Mar 17, 2017
Sold by
Guntherberg Sharon W
Bought by
Reeves Coleman D
Purchase Details
Closed on
Aug 26, 2015
Sold by
Guntherberg Alfred J
Bought by
Guntherberg Sharon Williamson
Purchase Details
Closed on
Apr 29, 1996
Bought by
Guntherberg Alfred J Ii And
Create a Home Valuation Report for This Property
The Home Valuation Report is an in-depth analysis detailing your home's value as well as a comparison with similar homes in the area
Home Values in the Area
Average Home Value in this Area
Purchase History
| Date | Buyer | Sale Price | Title Company |
|---|---|---|---|
| Colvin Anshun | $159,000 | -- | |
| Cdr Ventures Llc | -- | -- | |
| Reeves Coleman D | $77,000 | -- | |
| Guntherberg Sharon Williamson | -- | -- | |
| Guntherberg Alfred J Ii And | $63,000 | -- |
Source: Public Records
Mortgage History
| Date | Status | Borrower | Loan Amount |
|---|---|---|---|
| Open | Colvin Anshun | $156,120 | |
| Previous Owner | Cdr Ventures Llc | $170,000 |
Source: Public Records
Tax History Compared to Growth
Tax History
| Year | Tax Paid | Tax Assessment Tax Assessment Total Assessment is a certain percentage of the fair market value that is determined by local assessors to be the total taxable value of land and additions on the property. | Land | Improvement |
|---|---|---|---|---|
| 2025 | $2,215 | $67,470 | $8,000 | $59,470 |
| 2024 | $2,009 | $64,630 | $8,000 | $56,630 |
| 2023 | $1,482 | $64,478 | $8,000 | $56,478 |
| 2022 | $1,475 | $64,478 | $8,000 | $56,478 |
| 2021 | $1,515 | $63,412 | $8,000 | $55,412 |
| 2020 | $706 | $29,540 | $8,000 | $21,540 |
| 2019 | $676 | $29,540 | $8,000 | $21,540 |
| 2018 | $701 | $29,540 | $8,000 | $21,540 |
| 2017 | $788 | $33,175 | $8,000 | $25,175 |
| 2016 | $717 | $32,227 | $8,000 | $24,227 |
| 2015 | $741 | $33,256 | $8,000 | $25,256 |
| 2014 | $743 | $33,256 | $8,000 | $25,256 |
| 2013 | -- | $33,256 | $8,000 | $25,256 |
Source: Public Records
Map
Nearby Homes
- 207 Teel Rd
- 203 Teel Rd
- 206 Avenue C
- 108 Hillcrest Rd
- 204 Avenue C
- 125 Francolyn Terrace
- 209 Teel Rd
- 211 Briarcliff Rd
- 104 Hillcrest Rd
- 202 Avenue C
- 200 Teel Rd
- 200 Avenue C
- 102 Hillcrest Rd
- 110 Hillcrest Rd
- 130 Highland Dr
- 130 Highland Dr Unit 319
- 205 Avenue C
- 203 Avenue C
- 207 Avenue C
- 100 Briarcliff Rd