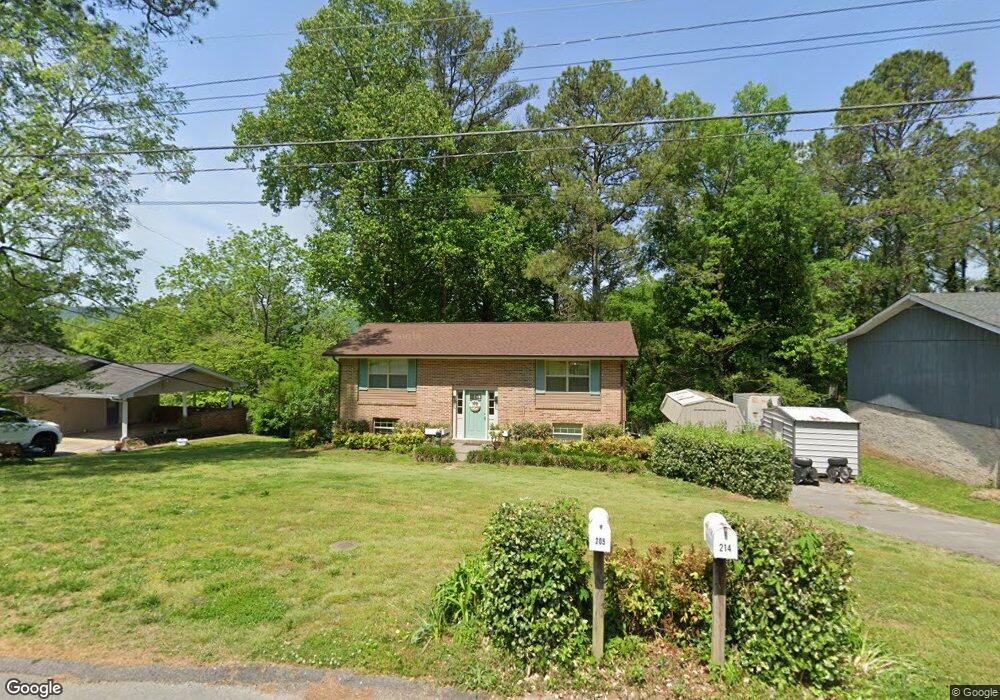
205 Tinker Bell Cir Flintstone, GA 30725
Flintstone NeighborhoodEstimated Value: $217,000 - $282,000
4
Beds
2
Baths
1,660
Sq Ft
$147/Sq Ft
Est. Value
About This Home
This home is located at 205 Tinker Bell Cir, Flintstone, GA 30725 and is currently estimated at $244,259, approximately $147 per square foot. 205 Tinker Bell Cir is a home located in Walker County with nearby schools including Chattanooga Valley Elementary School, Chattanooga Valley Middle School, and Ridgeland High School.
Ownership History
Date
Name
Owned For
Owner Type
Purchase Details
Closed on
Sep 28, 2007
Sold by
Residential Funding Co Llc
Bought by
Redpath Scot H and Redpath Kimberly J
Current Estimated Value
Home Financials for this Owner
Home Financials are based on the most recent Mortgage that was taken out on this home.
Original Mortgage
$66,500
Outstanding Balance
$41,949
Interest Rate
6.41%
Mortgage Type
New Conventional
Estimated Equity
$202,310
Purchase Details
Closed on
Feb 6, 2007
Sold by
Not Provided
Bought by
Redpath Scot and Redpath
Purchase Details
Closed on
Jan 24, 2006
Sold by
Not Provided
Bought by
Redpath Scot and Redpath
Home Financials for this Owner
Home Financials are based on the most recent Mortgage that was taken out on this home.
Original Mortgage
$66,400
Interest Rate
9.5%
Mortgage Type
New Conventional
Purchase Details
Closed on
Sep 15, 1971
Bought by
Atkins Allen W and Atkins Nell
Create a Home Valuation Report for This Property
The Home Valuation Report is an in-depth analysis detailing your home's value as well as a comparison with similar homes in the area
Home Values in the Area
Average Home Value in this Area
Purchase History
| Date | Buyer | Sale Price | Title Company |
|---|---|---|---|
| Redpath Scot H | $70,000 | -- | |
| Redpath Scot | -- | -- | |
| Residential Funding Co Llc | -- | -- | |
| Redpath Scot | $83,000 | -- | |
| Atkins Allen W | $2,300 | -- |
Source: Public Records
Mortgage History
| Date | Status | Borrower | Loan Amount |
|---|---|---|---|
| Open | Redpath Scot H | $66,500 | |
| Previous Owner | Redpath Scot | $66,400 |
Source: Public Records
Tax History Compared to Growth
Tax History
| Year | Tax Paid | Tax Assessment Tax Assessment Total Assessment is a certain percentage of the fair market value that is determined by local assessors to be the total taxable value of land and additions on the property. | Land | Improvement |
|---|---|---|---|---|
| 2024 | $1,521 | $70,299 | $7,045 | $63,254 |
| 2023 | $1,477 | $66,815 | $7,045 | $59,770 |
| 2022 | $1,298 | $53,731 | $3,914 | $49,817 |
| 2021 | $991 | $36,782 | $3,914 | $32,868 |
| 2020 | $913 | $32,596 | $3,914 | $28,682 |
| 2019 | $929 | $32,596 | $3,914 | $28,682 |
| 2018 | $863 | $32,596 | $3,914 | $28,682 |
| 2017 | $928 | $32,596 | $3,914 | $28,682 |
| 2016 | $928 | $32,596 | $3,914 | $28,682 |
| 2015 | $975 | $32,446 | $4,328 | $28,118 |
| 2014 | $884 | $32,446 | $4,328 | $28,118 |
| 2013 | $863 | $32,445 | $4,328 | $28,117 |
Source: Public Records
Map
Nearby Homes
- 569 Tinker Bell Cir
- 184 Cinderella Dr
- 113 Fox Run Cir N
- 4302 Happy Valley Rd
- 137 Fox Run Cir N
- 4766 Happy Valley Rd
- 76 Saddlebred Way
- 114 Saddlebred Way
- 18 Buck Creek Ln
- 278 Dry Valley Rd
- 306 Dry Valley Rd
- 880 Dry Valley Rd
- 2937 Happy Valley Rd
- 297 Draft St
- 307 Draft St
- 313 Draft St
- 259 Draft St
- 0 Dry Valley Rd Unit 1507680
- 346 Draft St
- 300 Draft St
- 229 Tinker Bell Cir
- 193 Tinker Bell Cir
- 214 Tinker Bell Cir
- 171 Tinker Bell Cir
- 192 Tinker Bell Cir
- 243 Tinker Bell Cir
- 234 Tinker Bell Cir
- 172 Tinker Bell Cir
- 159 Tinker Bell Cir
- 326 Burnt Mill Ln
- 262 Tinker Bell Cir
- 154 Tinker Bell Cir
- 269 Tinker Bell Cir
- 398 Burnt Mill Ln
- 566 Tinker Bell Cir
- 284 Burnt Mill Ln
- 292 Burnt Mill Ln
- 141 Tinker Bell Cir
- 282 Tinker Bell Cir
- 282 Tinker Bell Cir Unit 1