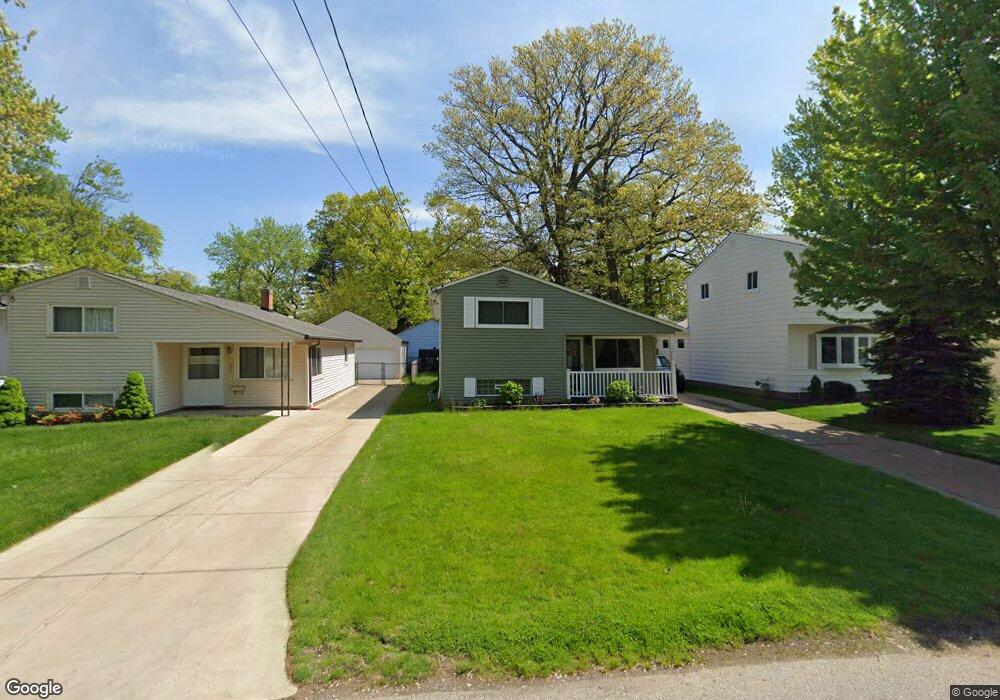
205 Traymore Blvd Eastlake, OH 44095
Estimated Value: $175,000 - $187,083
3
Beds
2
Baths
1,272
Sq Ft
$142/Sq Ft
Est. Value
About This Home
This home is located at 205 Traymore Blvd, Eastlake, OH 44095 and is currently estimated at $180,771, approximately $142 per square foot. 205 Traymore Blvd is a home located in Lake County with nearby schools including Jefferson Elementary School, Eastlake Middle School, and North High School.
Ownership History
Date
Name
Owned For
Owner Type
Purchase Details
Closed on
Feb 4, 2010
Sold by
Secretary Of Housing & Urban Development
Bought by
Wargo Amanda R
Current Estimated Value
Home Financials for this Owner
Home Financials are based on the most recent Mortgage that was taken out on this home.
Original Mortgage
$80,497
Outstanding Balance
$54,174
Interest Rate
5.37%
Mortgage Type
FHA
Estimated Equity
$126,597
Purchase Details
Closed on
Aug 25, 2009
Sold by
Simonic Phyllis A
Bought by
Us Bank Na
Purchase Details
Closed on
May 22, 2009
Sold by
Us Bank Na
Bought by
Secretary Of Housing & Urban Development
Purchase Details
Closed on
Nov 5, 1999
Sold by
Pat Di Geronimo Amedeo
Bought by
Whetstone Mark A and Simonic Phyllis A
Home Financials for this Owner
Home Financials are based on the most recent Mortgage that was taken out on this home.
Original Mortgage
$104,946
Interest Rate
7.78%
Mortgage Type
FHA
Purchase Details
Closed on
Apr 3, 1985
Bought by
Digeronimo Amedeo
Create a Home Valuation Report for This Property
The Home Valuation Report is an in-depth analysis detailing your home's value as well as a comparison with similar homes in the area
Home Values in the Area
Average Home Value in this Area
Purchase History
| Date | Buyer | Sale Price | Title Company |
|---|---|---|---|
| Wargo Amanda R | $84,613 | Attorney | |
| Us Bank Na | $64,000 | None Available | |
| Secretary Of Housing & Urban Development | -- | None Available | |
| Whetstone Mark A | $105,000 | Conway Land Title Company | |
| Digeronimo Amedeo | -- | -- |
Source: Public Records
Mortgage History
| Date | Status | Borrower | Loan Amount |
|---|---|---|---|
| Open | Wargo Amanda R | $80,497 | |
| Previous Owner | Whetstone Mark A | $104,946 |
Source: Public Records
Tax History Compared to Growth
Tax History
| Year | Tax Paid | Tax Assessment Tax Assessment Total Assessment is a certain percentage of the fair market value that is determined by local assessors to be the total taxable value of land and additions on the property. | Land | Improvement |
|---|---|---|---|---|
| 2024 | -- | $52,690 | $9,370 | $43,320 |
| 2023 | $3,739 | $38,690 | $7,490 | $31,200 |
| 2022 | $2,490 | $38,690 | $7,490 | $31,200 |
| 2021 | $2,502 | $38,690 | $7,490 | $31,200 |
| 2020 | $2,447 | $33,640 | $6,510 | $27,130 |
| 2019 | $2,278 | $33,640 | $6,510 | $27,130 |
| 2018 | $2,186 | $29,820 | $10,290 | $19,530 |
| 2017 | $2,123 | $29,820 | $10,290 | $19,530 |
| 2016 | $1,984 | $29,820 | $10,290 | $19,530 |
| 2015 | $1,936 | $29,820 | $10,290 | $19,530 |
| 2014 | $1,836 | $29,820 | $10,290 | $19,530 |
| 2013 | $1,836 | $29,820 | $10,290 | $19,530 |
Source: Public Records
Map
Nearby Homes
- 211 Plymouth Rd
- 37750 Willow Dr
- 132 Shelton Blvd
- 307 Shelton Blvd
- 1568 Westover Dr
- 284 E Overlook Dr
- 37818 Lake Shore Blvd
- 0 V L Lake Shore Blvd Unit 5070796
- 38156 Cross Creek Dr Unit 65
- 1285 Leeward Ln Unit B
- 1245 Leeward Ln Unit A
- 38207 Cross Creek Dr Unit 38
- 1298 Beech St
- 36536 Lakehurst Dr
- 38256 Lake Shore Blvd
- 503 E Overlook Dr
- 1068 Elmwood Dr
- 38598 Granite Dr Unit 31
- 91 Sunset Cove Cir
- 2088 Canterbury Dr
- 209 Traymore Blvd
- 203 Traymore Blvd
- 213 Traymore Blvd
- 204 Paxton Rd
- 195 Traymore Blvd
- 219 Traymore Blvd
- 215 Traymore Blvd
- 210 Paxton Rd
- 198 Paxton Rd
- 208 Traymore Blvd
- 214 Paxton Rd
- 204 Traymore Blvd
- 210 Traymore Blvd
- 193 Traymore Blvd
- 200 Traymore Blvd
- 214 Traymore Blvd
- 218 Paxton Rd
- 196 Traymore Blvd
- 216 Traymore Blvd
- 223 Traymore Blvd