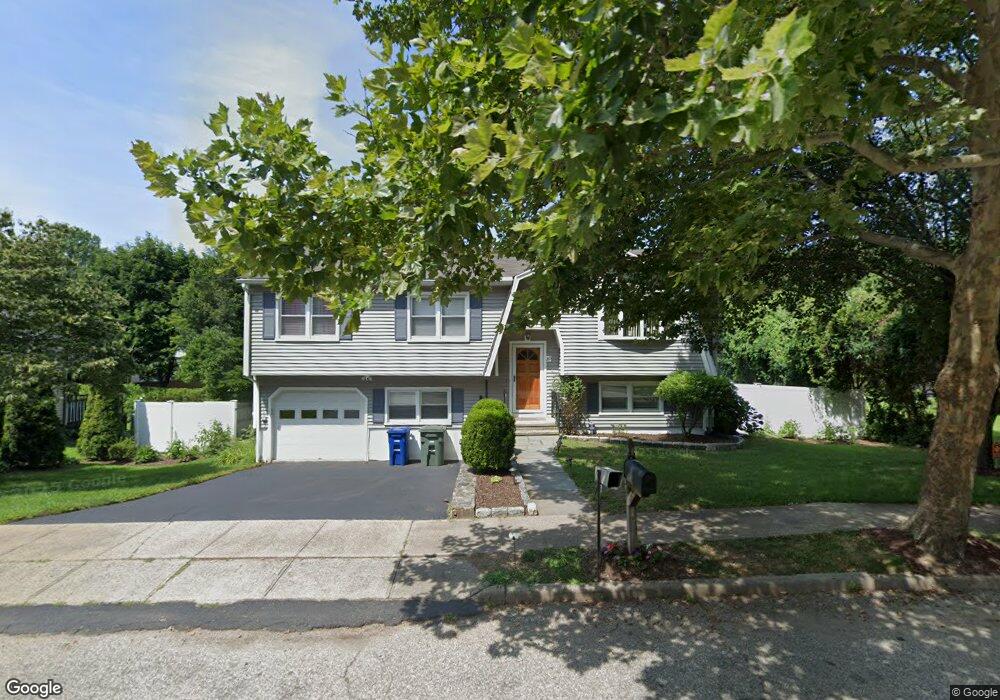
205 Village Ln Bridgeport, CT 06606
North End NeighborhoodEstimated Value: $436,339 - $473,000
4
Beds
2
Baths
1,132
Sq Ft
$404/Sq Ft
Est. Value
About This Home
This home is located at 205 Village Ln, Bridgeport, CT 06606 and is currently estimated at $457,335, approximately $404 per square foot. 205 Village Ln is a home located in Fairfield County with nearby schools including Wilbur L. Cross Elementary School, Central High School, and Northeastern Adventist Academy - Fairfield County.
Ownership History
Date
Name
Owned For
Owner Type
Purchase Details
Closed on
May 16, 2023
Sold by
Sanchez Emma E
Bought by
Sanchez Juan A
Current Estimated Value
Purchase Details
Closed on
Sep 30, 2010
Sold by
Ohlin Ellen
Bought by
Sanchez Juan A and Sanchez Emma E
Home Financials for this Owner
Home Financials are based on the most recent Mortgage that was taken out on this home.
Original Mortgage
$234,837
Interest Rate
4.44%
Mortgage Type
Purchase Money Mortgage
Purchase Details
Closed on
Mar 2, 2001
Sold by
Purcell Sandra L and Purcell Susan L
Bought by
Ohlin Ellen and Ohlin Kenneth A
Purchase Details
Closed on
Aug 14, 1996
Sold by
Torres Benigno and Torres Maria V
Bought by
Purcell Sandra L and Purcell Susan L
Create a Home Valuation Report for This Property
The Home Valuation Report is an in-depth analysis detailing your home's value as well as a comparison with similar homes in the area
Home Values in the Area
Average Home Value in this Area
Purchase History
| Date | Buyer | Sale Price | Title Company |
|---|---|---|---|
| Sanchez Juan A | -- | None Available | |
| Sanchez Juan A | -- | None Available | |
| Sanchez Juan A | $238,000 | -- | |
| Sanchez Juan A | $238,000 | -- | |
| Ohlin Ellen | $178,000 | -- | |
| Ohlin Ellen | $178,000 | -- | |
| Purcell Sandra L | $118,000 | -- | |
| Purcell Sandra L | $118,000 | -- |
Source: Public Records
Mortgage History
| Date | Status | Borrower | Loan Amount |
|---|---|---|---|
| Previous Owner | Purcell Sandra L | $234,837 | |
| Previous Owner | Purcell Sandra L | $17,975 |
Source: Public Records
Tax History Compared to Growth
Tax History
| Year | Tax Paid | Tax Assessment Tax Assessment Total Assessment is a certain percentage of the fair market value that is determined by local assessors to be the total taxable value of land and additions on the property. | Land | Improvement |
|---|---|---|---|---|
| 2025 | $7,621 | $175,400 | $78,200 | $97,200 |
| 2024 | $7,621 | $175,400 | $78,200 | $97,200 |
| 2023 | $7,621 | $175,400 | $78,200 | $97,200 |
| 2022 | $7,621 | $175,400 | $78,200 | $97,200 |
| 2021 | $7,621 | $175,400 | $78,200 | $97,200 |
| 2020 | $8,131 | $150,600 | $61,260 | $89,340 |
| 2019 | $8,131 | $150,600 | $61,260 | $89,340 |
| 2018 | $8,188 | $150,600 | $61,260 | $89,340 |
| 2017 | $8,188 | $150,600 | $61,260 | $89,340 |
| 2016 | $8,188 | $150,600 | $61,260 | $89,340 |
| 2015 | $7,683 | $182,050 | $67,230 | $114,820 |
| 2014 | $7,683 | $182,050 | $67,230 | $114,820 |
Source: Public Records
Map
Nearby Homes
- 1675 Old Town Rd
- 45 Rogerson Cir
- 1800 Chopsey Hill Rd
- 135 Grey Rock Rd
- 715 Frenchtown Rd Unit 31
- 32 Karen Ct Unit b
- 238 Griffin Ave
- 291 Frenchtown Rd
- 26 Karen Ct Unit A
- 165 Yaremich Dr
- 65 Clearview Dr
- 90 Sequoia Rd
- 7 Stone Ridge Rd
- 182 Trumbull Ave
- 142 Chatham Terrace
- 344 Cambridge St
- 54 Agnes St
- 87 Oliver St
- 181 Cityview Ave
- 365 Platt St
- 185 Village Ln
- 223 Village Ln
- 92 Williamsburg Rd
- 80 Williamsburg Rd
- 104 Williamsburg Rd
- 212 Village Ln
- 165 Village Ln
- 180 Village Ln
- 62 Williamsburg Rd
- 235 Village Ln
- 220 Village Ln
- 140 Williamsburg Rd
- 285 Village Ln
- 155 Village Ln
- 48 Williamsburg Rd
- 160 Village Ln
- 83 Williamsburg Rd
- 230 Village Ln
- 75 Williamsburg Rd
- 1965 Chopsey Hill Rd