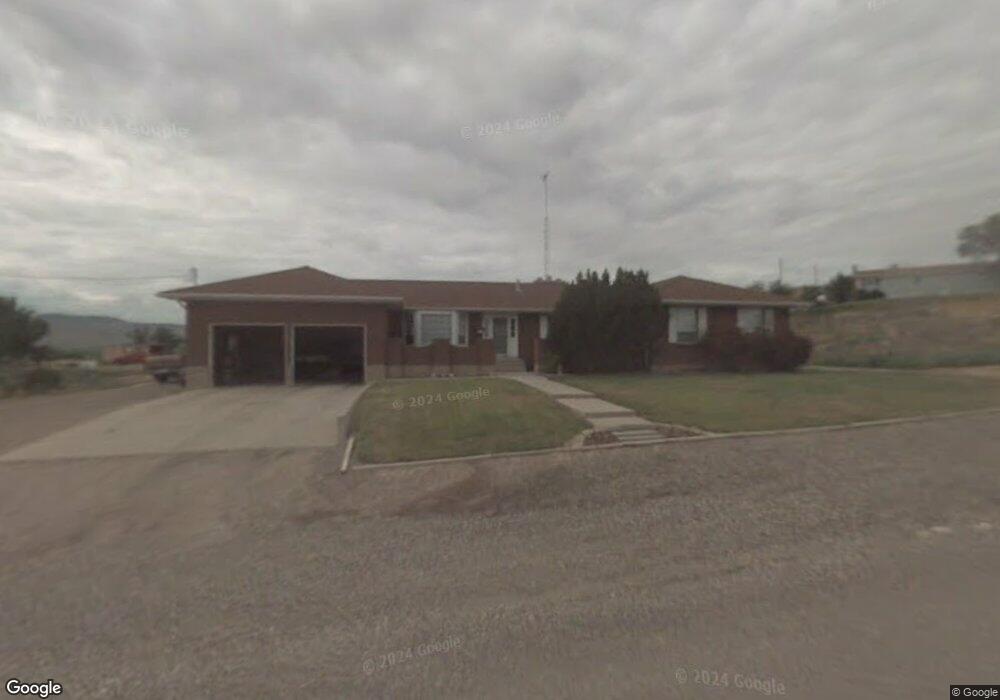
205 W 200 S Redmond, UT 84652
Estimated Value: $346,000 - $456,000
3
Beds
3
Baths
4,206
Sq Ft
$99/Sq Ft
Est. Value
About This Home
This home is located at 205 W 200 S, Redmond, UT 84652 and is currently estimated at $415,277, approximately $98 per square foot. 205 W 200 S is a home with nearby schools including Salina School, North Sevier Middle School, and North Sevier High School.
Ownership History
Date
Name
Owned For
Owner Type
Purchase Details
Closed on
Nov 21, 2025
Sold by
Mickelsen Linda Mae and Mickelsen Ted
Bought by
Fowkes Kagun and Fowkes Swazie
Current Estimated Value
Home Financials for this Owner
Home Financials are based on the most recent Mortgage that was taken out on this home.
Original Mortgage
$389,500
Outstanding Balance
$389,500
Interest Rate
6.3%
Mortgage Type
New Conventional
Estimated Equity
$25,777
Purchase Details
Closed on
Oct 30, 2025
Sold by
Glen Que Mickelsen Living Trust and Mickelsen Ted
Bought by
Mickelsen Linda Mae and Mickelsen Ted
Home Financials for this Owner
Home Financials are based on the most recent Mortgage that was taken out on this home.
Original Mortgage
$389,500
Outstanding Balance
$389,500
Interest Rate
6.3%
Mortgage Type
New Conventional
Estimated Equity
$25,777
Purchase Details
Closed on
Sep 18, 2023
Sold by
Mickelsen Glen Q
Bought by
Glen Que Mickelsen Living Trust and Mickelsen
Purchase Details
Closed on
Mar 5, 2020
Sold by
Mickelsen Glen O
Bought by
Pierce William Harold and Pierce Loretta K
Create a Home Valuation Report for This Property
The Home Valuation Report is an in-depth analysis detailing your home's value as well as a comparison with similar homes in the area
Purchase History
| Date | Buyer | Sale Price | Title Company |
|---|---|---|---|
| Fowkes Kagun | -- | Backman Title Services | |
| Mickelsen Linda Mae | -- | Backman Title Services | |
| Glen Que Mickelsen Living Trust | -- | Backman Title Services | |
| Pierce William Harold | -- | None Available | |
| Mickelsen Glen Q | -- | None Available |
Source: Public Records
Mortgage History
| Date | Status | Borrower | Loan Amount |
|---|---|---|---|
| Open | Fowkes Kagun | $389,500 |
Source: Public Records
Tax History
| Year | Tax Paid | Tax Assessment Tax Assessment Total Assessment is a certain percentage of the fair market value that is determined by local assessors to be the total taxable value of land and additions on the property. | Land | Improvement |
|---|---|---|---|---|
| 2025 | $1,852 | $219,003 | $33,840 | $185,163 |
| 2024 | $1,852 | $234,913 | $27,947 | $206,966 |
| 2023 | $2,028 | $252,425 | $27,996 | $224,429 |
| 2022 | $2,162 | $218,511 | $27,715 | $190,796 |
| 2021 | $1,488 | $124,423 | $18,425 | $105,998 |
| 2020 | $1,606 | $125,936 | $19,938 | $105,998 |
| 2019 | $1,505 | $125,940 | $19,940 | $106,000 |
| 2018 | $1,494 | $110,810 | $17,940 | $92,870 |
| 2017 | $1,473 | $104,280 | $17,940 | $86,340 |
| 2016 | $1,110 | $100,650 | $0 | $0 |
| 2015 | $1,110 | $100,650 | $0 | $0 |
| 2014 | $1,110 | $100,650 | $0 | $0 |
Source: Public Records
Map
Nearby Homes
Your Personal Tour Guide
Ask me questions while you tour the home.